

| Name | Description | Default |
|---|---|---|
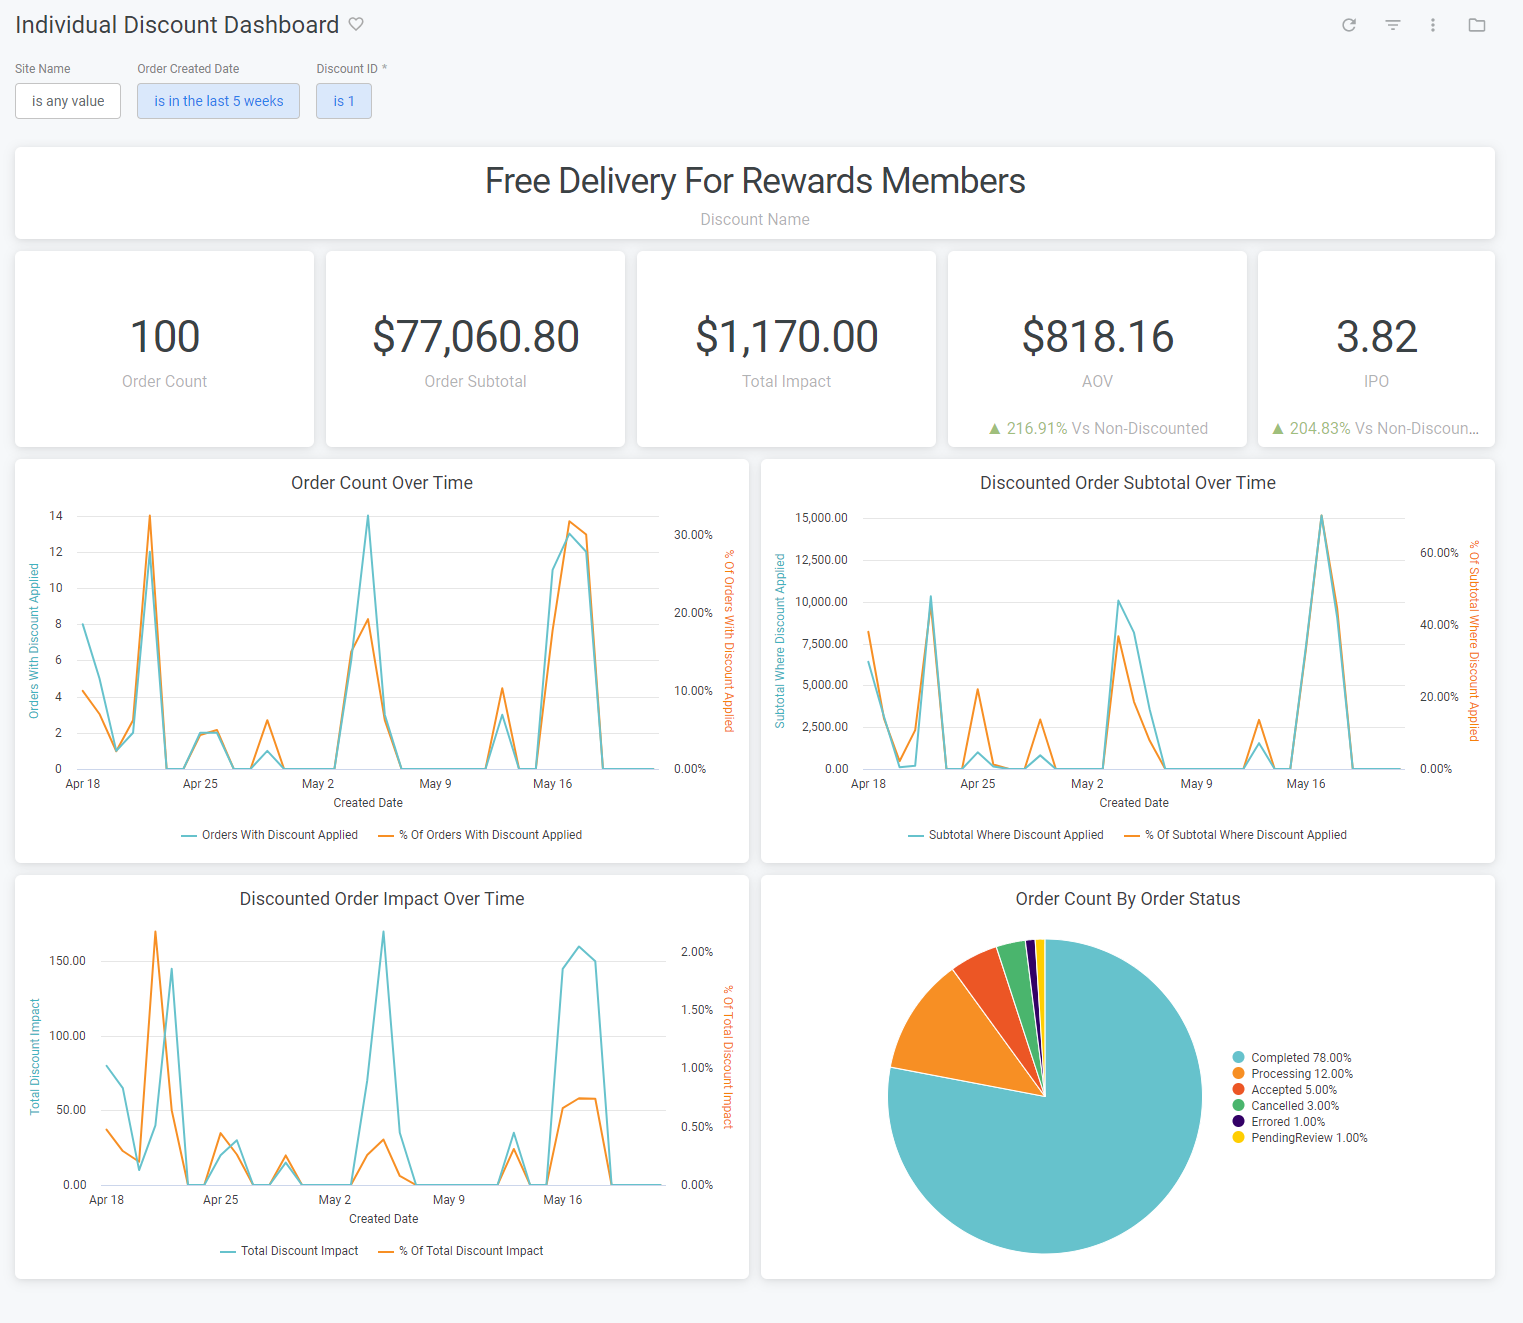
| Site Name | Restrict results to one or more of your sites. | All |
| Order Created Date | Limit results to only orders created within this time range. | Past five weeks |
| Discount ID | The unique identifier for a discount. Note: This is a required filter and the user must enter a value for the dashboard to render. | Empty |
| Name | Description |
|---|---|
| Average Order Value | The average order total for all orders. |
| Items Per Order | The average number of order items per order. |
| Order Subtotal | The sum of all order subtotals where this discount has been applied. |
| Order Count | The count of all orders where this discount has been applied. |
| Total Impact | The sum of the impact on all orders where this discount has been applied. |
| Name | Description |
|---|---|
| Order Count Over Time | The order count bucketed by calendar day. |
| Discounted Order Subtotal Over Time | The order subtotal bucketed by calendar day. |
| Discounted Order Impact Over Time | The total impact bucketed by calendar day. |
| Order Count By Order Status | The count of all orders where this discount has been applied grouped by the status of the associated order. |