

| Name | Description | Default |
|---|---|---|
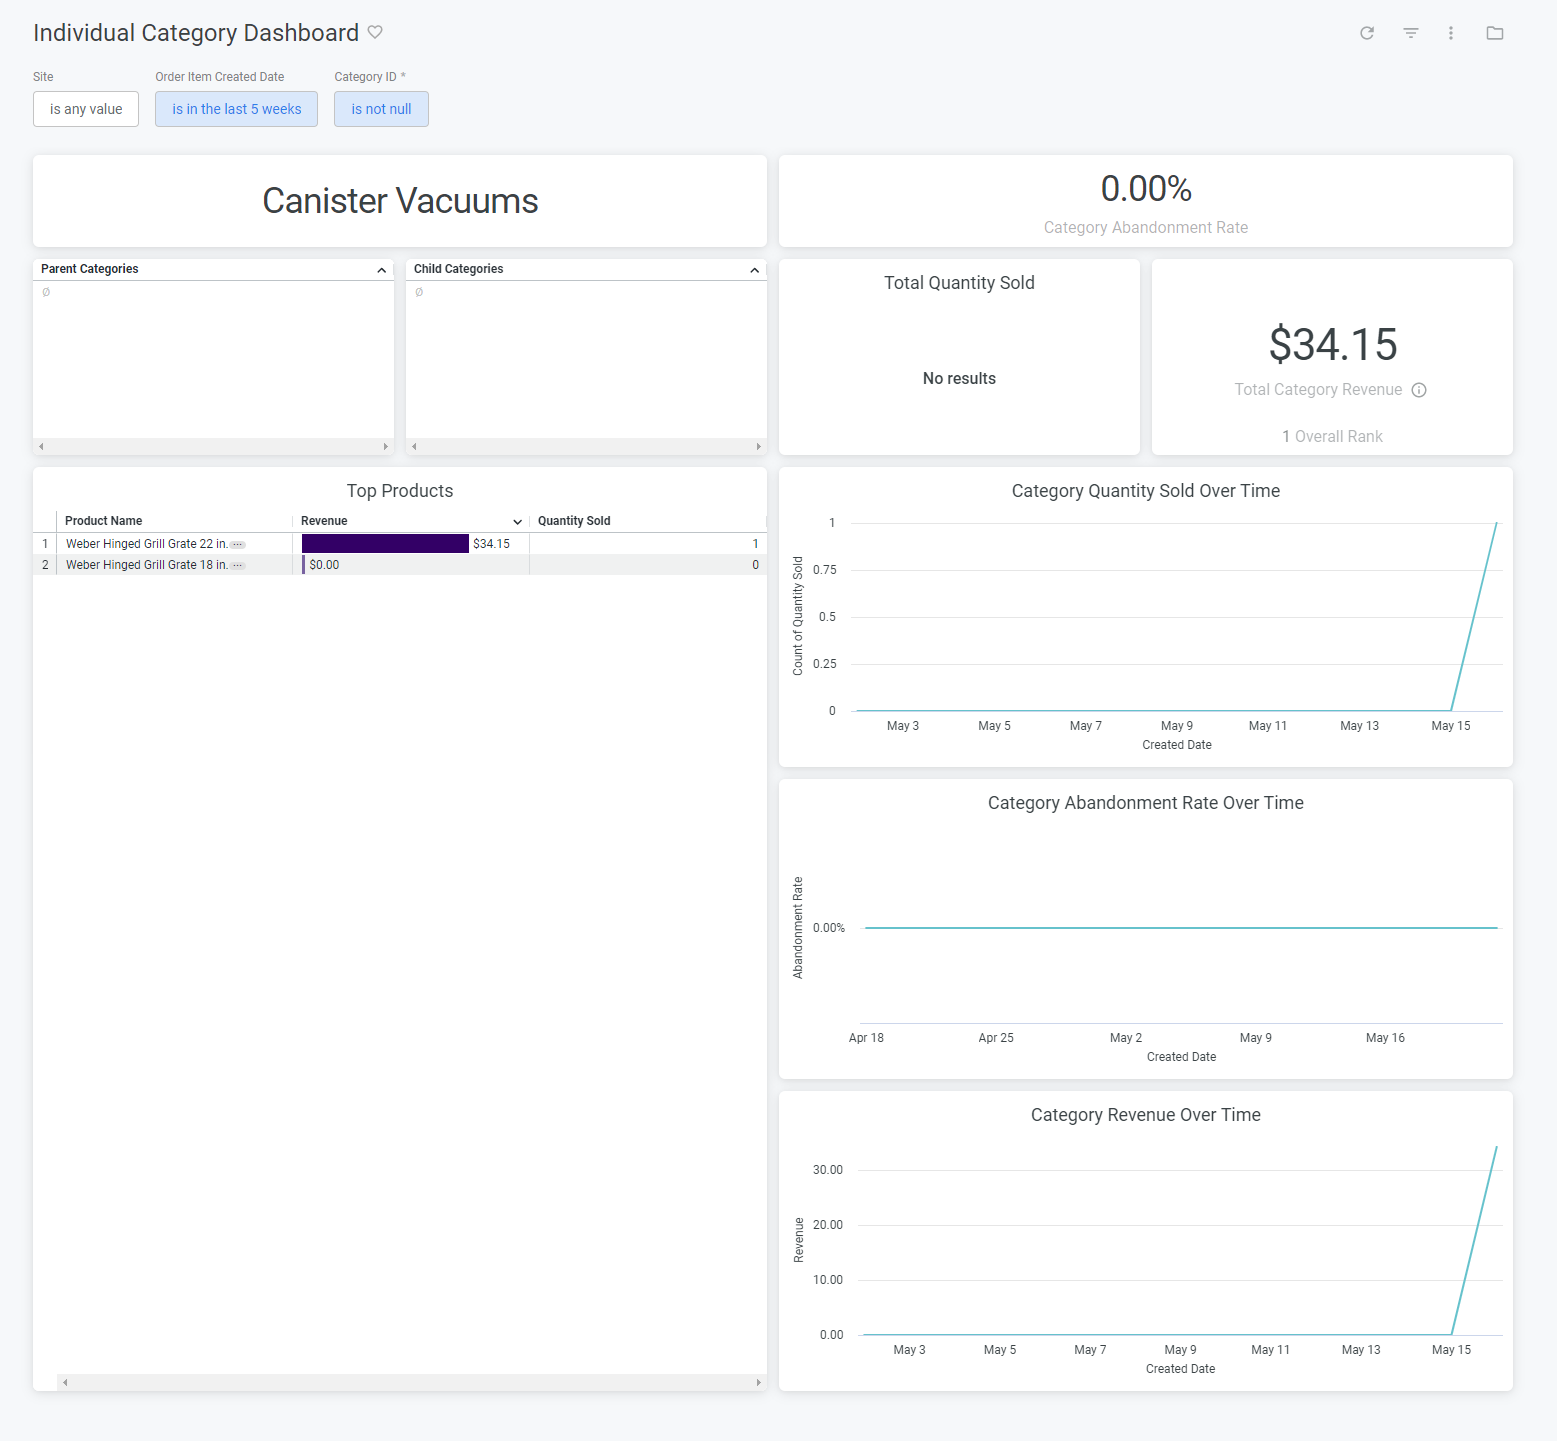
| Site | Restrict results to one or more of your sites. | All |
| Order Item Created Date | Limit results to only order items created within this time range. | Past ten weeks |
| Category ID | Specifies the category on which to report. | Empty |
| Name | Description |
|---|---|
| Abandonment Rate | The percentage of carts created that expire before placing an order. |
| Total Quantity Sold | Sum of the quantity for each order item where the associated order is not in abandoned or cancelled status. |
| Total Revenue | The sum of order total for all orders. |
| Name | Description |
|---|---|
| Category Abandonment Rate | The abandonment rate for the entire product category. |
| Category Quantity Sold Over Time | Line graph showing the daily quantity sold. |
| Category Abandonment Rate Over Time | Line graph showing the abandonment rate for the category for each day. |
| Category Revenue Over Time | Line graph showing the total revenue for the category for each day. |
| Child Categories | A list of the child categories for this category. Clicking the name will link to the individual category dashboard for the child category. |
| Parent Categories | A list of the parent categories for this category. Clicking the name will link to the individual category dashboard for the parent category. |
| Top Products | A list of the products with the highest total revenue within that category. Quantity sold is also displayed for each product. |
| Total Quantity Sold | The quantity sold for the entire product category. |
| Total Category Revenue | The total revenue for the entire product category. |