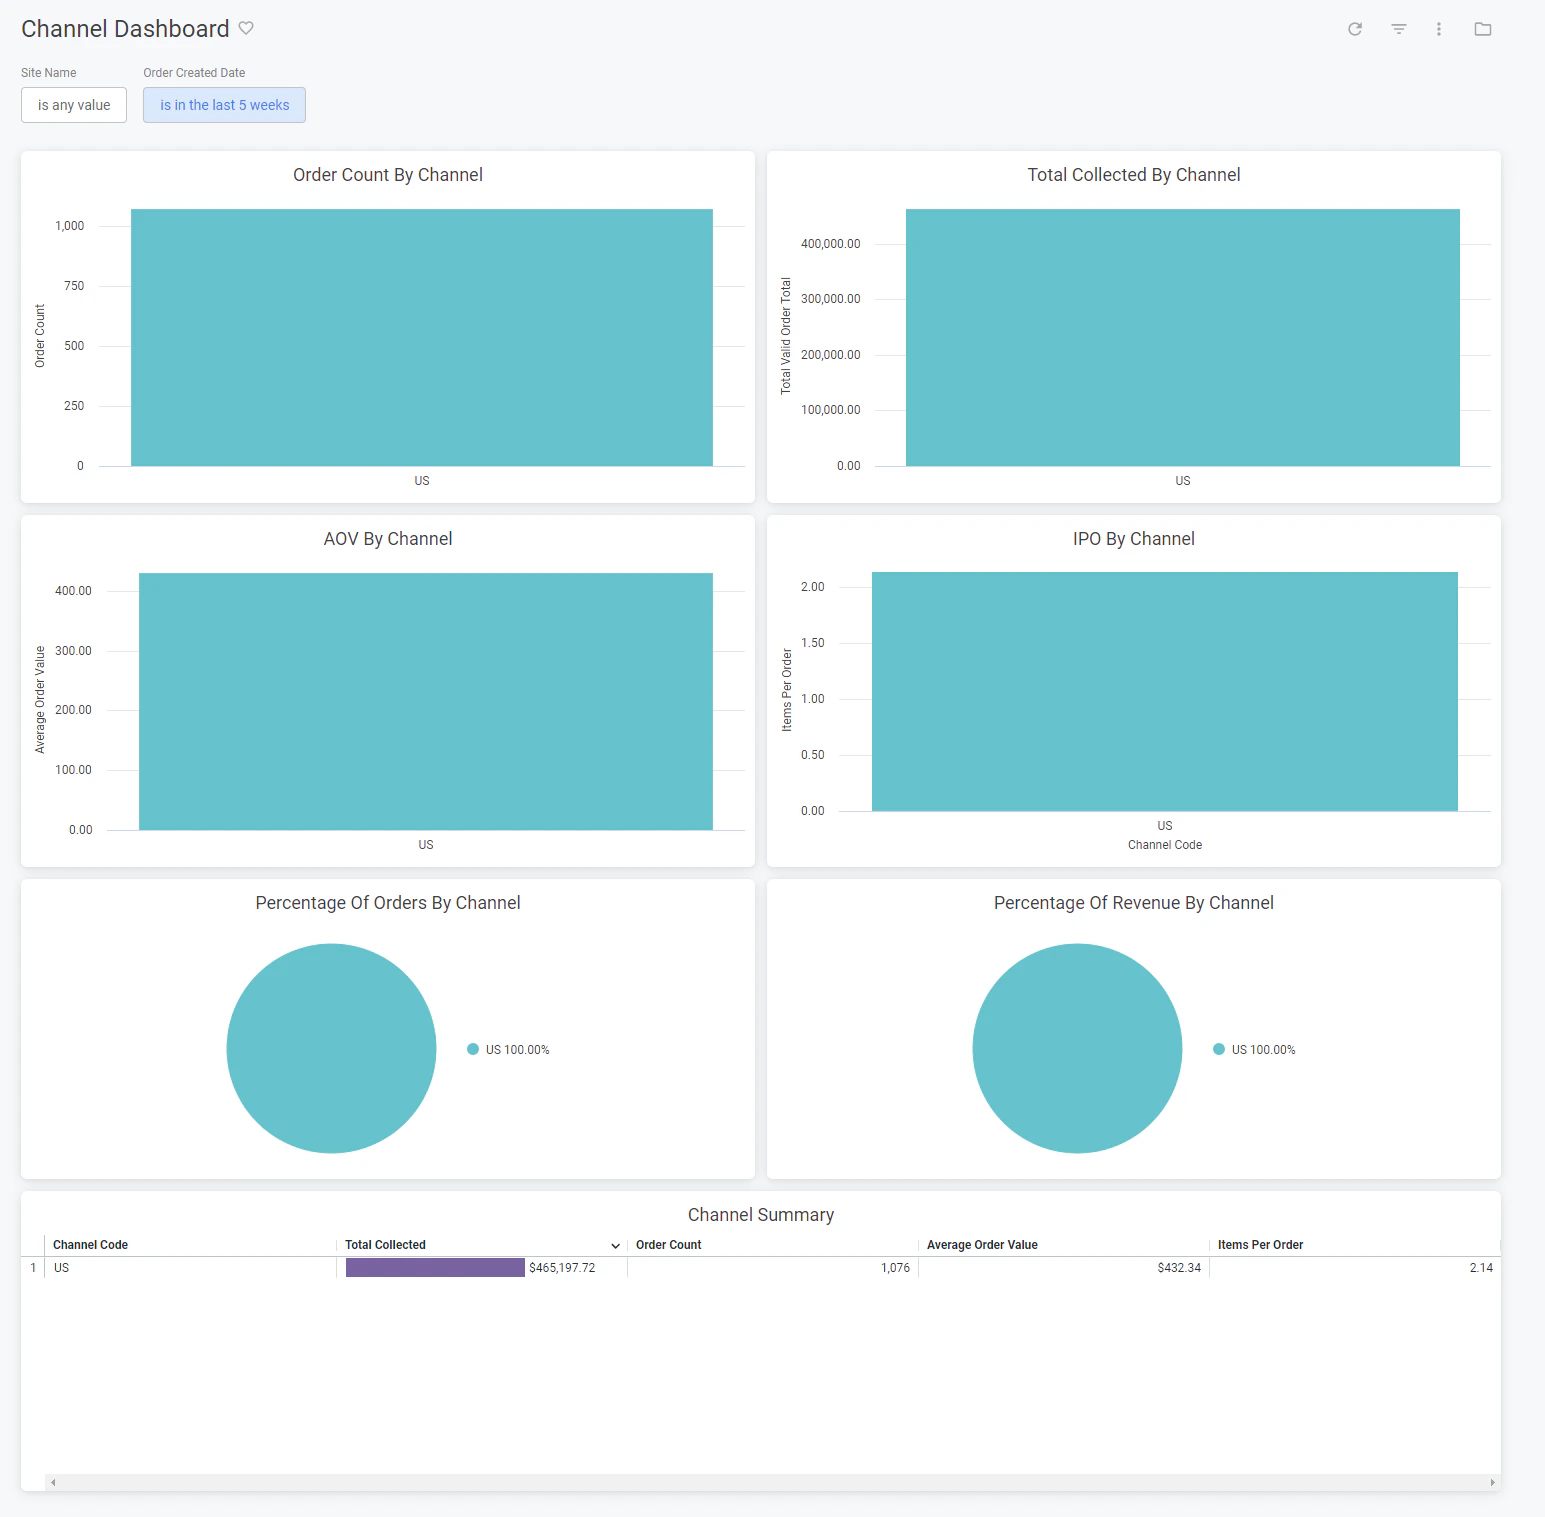
Channel Dashboard

The Channel dashboard breaks down metrics by specific channels, displaying performance for a particular channel or comparing performance across multiple channels. This can be viewed under the orders topic at Kibo Standard Reports > Order Channel Dashboard in the navigation menu.

Example of the Channel dashboard with bar and pie charts

The supported filters that can be applied to this dashboard are:

NameDescriptionDefault
Site NameRestrict results to one or more of your sites.All
Order Created DateLimit results to only orders created within this time range.Past five weeks

The measures that are calculated by this dashboard are:

NameDescription
Total CollectedSum of the total for all valid orders.
Order CountCount of all valid orders.
Average Order ValueThe order total divided by the valid order count.
Items Per OrderThe count of all order items associated with valid orders divided by the count of all valid orders.

The tiles that make up this dashboard are:

NameDescription
Order Count By ChannelThe count of valid orders for each channel.
Total Collected By ChannelThe total collected for each channel.
AOV By ChannelThe average order value for each channel.
IPO By ChannelThe items per order for each channel.
Percentage Of Orders By ChannelThe order count for each channel as a percentage of the order count for all channels.
Percentage Of Revenue By ChannelThe total collected for each channel as a percentage of the total collected for all channels.
Channel SummaryThe total collected, order count, average order value, and items per order for each channel.