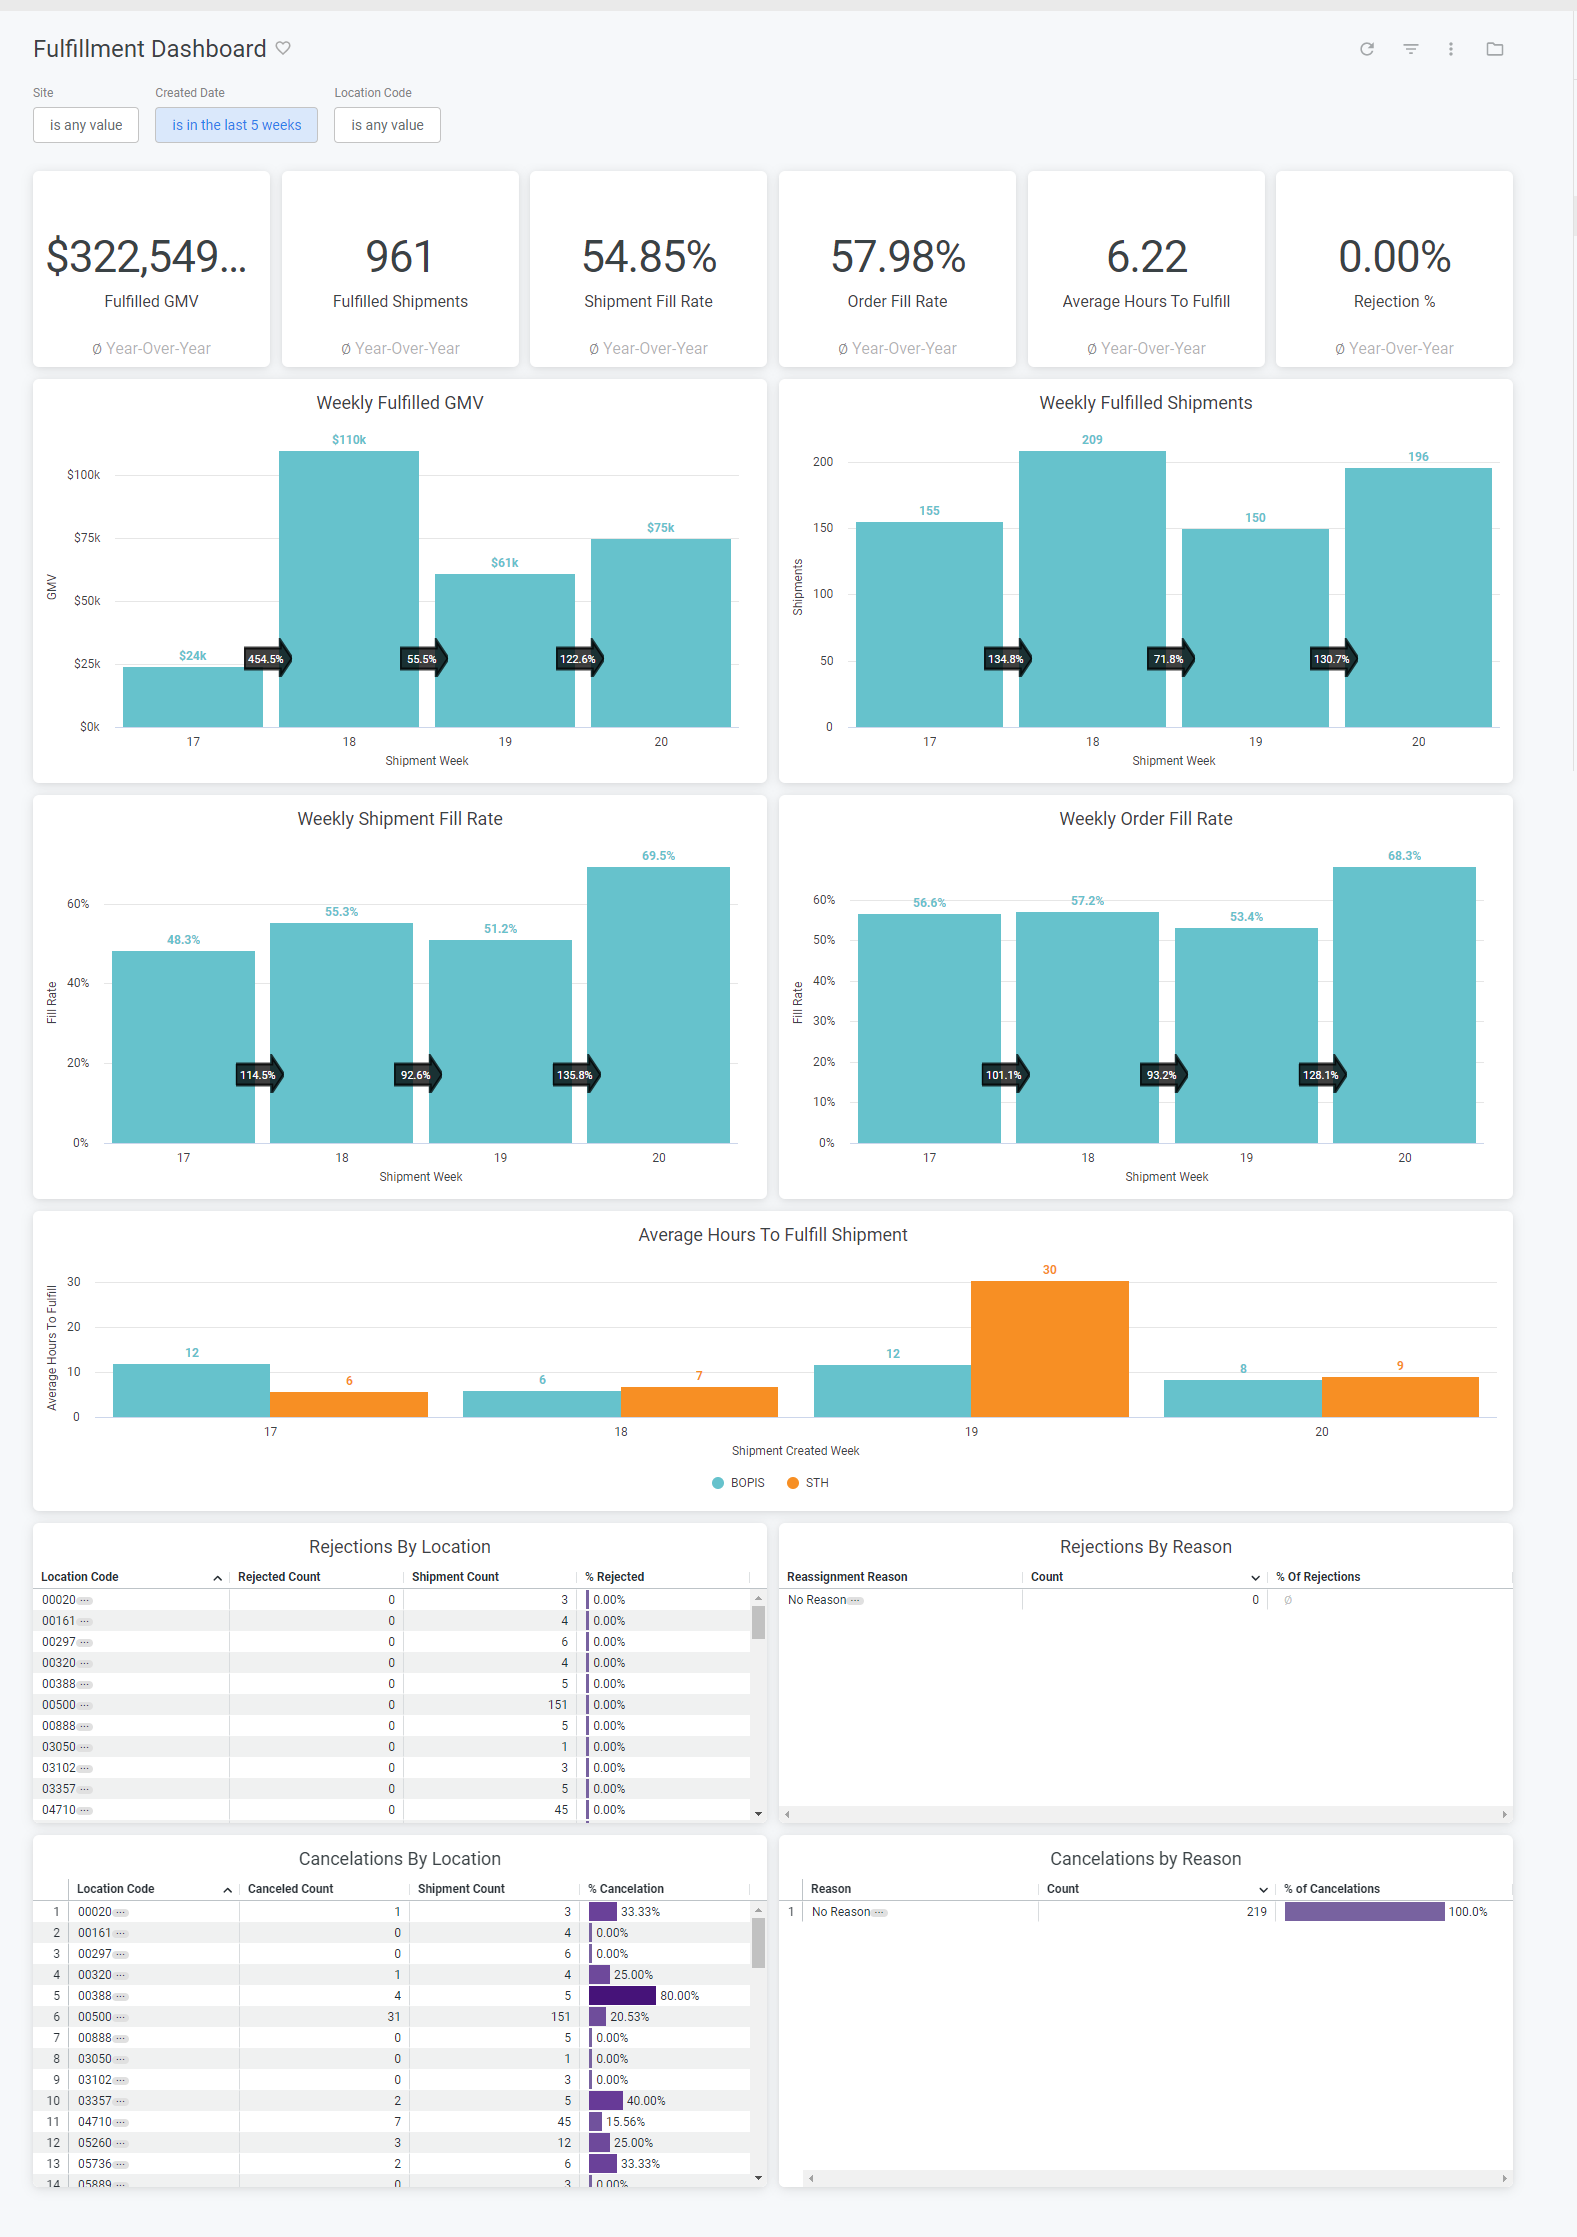
| Fulfilled GMV | The fulfilled GMV for all shipments. Year-over-year uses the same calendar dates one year prior. |
| Fulfilled Shipments | The fulfilled shipment count. Year-over-year uses the same calendar dates one year prior. |
| Shipment Fill Rate | The shipment fill rate. Year-over-year uses the same calendar dates one year prior. |
| Order Fill Rate | The order fill rate. Year-over-year uses the same calendar dates one year prior. |
| Average Hours To Fulfill | The average hours to fulfill all shipments. Year-over-year uses the same calendar dates one year prior. |
| Rejection Percentage | The rejection percentage for all shipments. Year-over-year uses the same calendar dates one year prior. |
| Weekly Fulfilled GMV | The fulfilled GMV bucketed by the shipment created week. Year-over-year uses the same calendar dates one year prior. |
| Weekly Fulfilled Shipments | The fulfilled shipment count bucketed by the shipment created week. Year-over-year uses the same calendar dates one year prior. |
| Weekly Shipment Fill Rate | The shipment fill rate bucketed by the shipment created week. Year-over-year uses the same calendar dates one year prior. |
| Weekly Order Fill Rate | The order fill rate bucketed by the shipment created week. Year-over-year uses the same calendar dates one year prior. |
| Average Hours To Fulfill Shipment | The fulfilled GMV bucketed by the shipment created week. Each series represents a shipment type. |
| Rejections By Location | The count of rejected shipments, count of total shipments, and the rejection percentage for each location code. |
| Rejections By Reason | The count of rejected shipments and the percentage of total rejections that count represents for each rejection reason. |
| Cancelations by Location | The count of canceled shipments, count of total shipments, and the cancelation percentage for each location code. |
| Cancelations by Reason | The count of canceled shipments and the percentage of total cancelations that count represents for each cancelation reason. |