

Watch: Reporting Overview
Reporting Definitions
Before getting into the different aspects of the Reporting UI, here are some definitions that should be understood in order to browse reports:- A dashboard is a homepage where all reports about a particular topic are displayed.
- Filters can be applied to those reports to specify the data being collected.
- Dashboards consist of measures and tiles.
- A measure is an aggregated calculation. For example, an order has a tax total attribute that is the amount of tax charged to the customer. We could add a measure called Total Tax that is the sum of the tax total for all orders.
- The dashboard is laid out as a series of tiles, which are the individual reports within the dashboard topic. These tiles display measures as well as additional data that are not aggregated calculations.
- Explores are a collection of data focused on a particular topic. They can be used for creating custom reports or ad hoc data exploration.
- Explores consist of views, which in turn are made up of measures, dimensions, and occasionally filters.
- A view is a section of the explore that displays a group of related data. Views usually include an associated measure that indicates the total records for that element on the site, as well as a set of dimensions.
- Dimensions are data values for a single record (like one order), in contrast to a measure that calculates the value for a set of records (like all orders). Dimensions are often related to API parameters; for instance, the Customer Explore includes a view that details customer datapoints found in the Customer APIs.
User Permissions
Only one default user role has the permissions necessary to access Reporting, the Report Super User. To allow other users to view and/or edit reports, you must either give them that role or add the appropriate behaviors to another role and assign it to them. The two behaviors used for reporting access are:- Report Read: Allows the user to view all reports and download them.
- Report Definition Update: Allows the user to edit existing report definitions, which includes creating and saving personal reports (visible to them), group reports (visible to other editors), and custom reports.
View Reports
There are report categories, or “dashboards,” that are provided out-of-the-box as Kibo Standard Reports. Custom reports are detailed in their own section of this guide.- Go to Main > Reports. The landing page will display the Order Dashboard with default filter options (specifically, displaying orders from all sites from the current month).
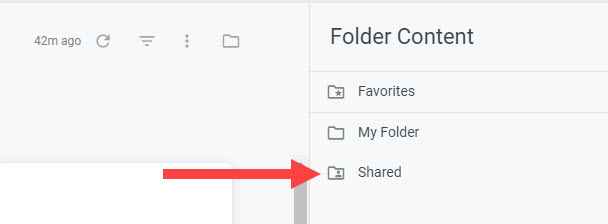
- Click the folder icon in the top right. A navigation menu of the folder directory appears.
- Click Shared. Favorites and My Folder are personal folders that are empty by default.
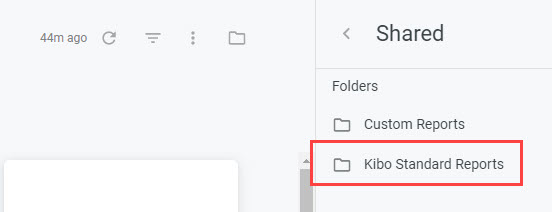
- Click Kibo Standard Reports.
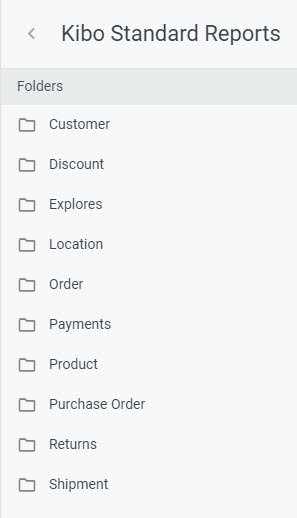
- A list of all report topics is displayed. Select a topic.
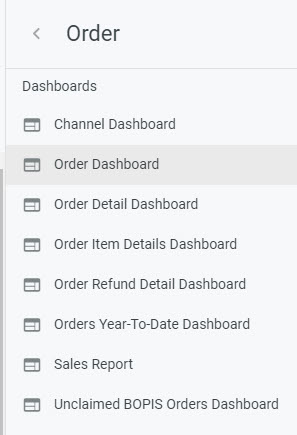
- All of the dashboards within that report topic is displayed. Click any dashboard to view that specific report.
Dashboards
A dashboard is a homepage where all reports about a particular topic are displayed. There are numerous dashboards for different topics in KCCP covering locations, discounts, shipments, products, orders, payments, purchase orders, returns, and more.
Explores and Views
Explores are a collection of data focused on a particular topic. They can be used for creating custom reports or ad hoc data exploration and can be found at Kibo Standard Reports > Explores. Each of these explores contains at least one view that displays data. Views usually include an associated measure that indicates the total records for that element on the site, as well as a set of dimensions. Dimensions are data values for a single record (like one order), in contrast to a measure that calculates the value for a set of records (like all orders). Dimensions are often related to API parameters; for instance, the Customer Explore includes a view that details customer data points found in the Customer APIs.Data Structure
To help you get the most out of our reporting tools and even build your own custom reports, we’re providing two essential resources that define the structure and meaning of the data within our system: the Entity-Relationship Diagram (ERD) and the Data Dictionary.Entity-Relationship Diagram (ERD)
The ERD below is a visual blueprint of our database. It serves as the conceptual and logical data model for our system.The diagram visually represents the entities (tables), the attributes (columns/fields) within those entities, and the defined relationships between them.It explicitly illustrates the cardinality (one-to-one, one-to-many, many-to-many) and the optionality of connections between entities. By clearly identifying primary and foreign keys (indicated as PK & FK in the diagram), the ERD dictates the precise join paths and join types required to correctly link disparate data points.This ensures data integrity and prevents reporting errors when aggregating data across multiple tables. This ERD is especially useful for creating custom reports in Looker and integrating data from exchanges into your environment. The ERD below primary shows -orders, shipments, locations, and inventory entities. The Order table serves as the core entity, linked with Order_Items, Shipment, and Locations to capture the complete order-to-fulfillment process. The Shipment section includes related tables such as Shipment_Items, Shipment_Data, Shipment_Packages, and their value tables, which store detailed shipment-level and item-level information. The Locations structure defines site-specific details through supporting tables like Location_Attributes, Location_Attributes_Values, and Locationgroups. The diagram also includes a separate Inventory ERD, where tables like silo_XXXX_inventory, silo_XXXX_product, and silo_XXXX_location track product availability across locations. It is important to include the tenantid field while joining tables and convert orderid before linking the Order and Shipment tables. The prefix XXXX_ in inventory tables acts as a placeholder for tenant-specific schemas
Data Dictionary
Without clear documentation, data can be easily misinterpreted. The purpose of this Data Dictionary is to eliminate ambiguity by providing comprehensive, technical, and business context for our core data elements. This reference guide defines each asset—from a table to a specific field—to ensure all analysts, developers, and business users are working with a unified understanding of our data structure and its meaning.order
Field Name | Type | Description |
iseligibleforreturns | BOOLEAN | Indicates whether the order is eligible for returns. |
originalcartid | STRING | The identifier of the original cart. |
parentreturnid | STRING | The identifier of the parent return. |
sourcedevice | STRING | The source device used to place the order. |
cancelleddate | TIMESTAMP | The date when the order was cancelled. |
discountedsubtotal | FLOAT | The discounted subtotal. |
discountedtotal | FLOAT | The discounted total. |
handlingamount | FLOAT | The amount of handling fees. |
lineitemsubtotalwithorderadjustments | FLOAT | The subtotal of line items with order adjustments. |
shippingamountbeforediscountsandadjustments | FLOAT | The shipping amount before discounts and adjustments. |
dutytotal | FLOAT | The total amount of duties. |
shippingsubtotal | FLOAT | The subtotal for shipping fees. |
amountremainingforpayment | FLOAT | The amount remaining for payment. |
parentcheckoutid | STRING | The identifier of the parent checkout. |
parentorderid | STRING | The identifier of the parent order. |
ispartialorder | BOOLEAN | Indicates whether the order is a partial order. |
siteid | INTEGER | The identifier of the site. |
tenantid | INTEGER | The identifier of the tenant. |
userid | STRING | The identifier of the user. |
customeraccountid | INTEGER | The identifier of the customer account. |
istaxexempt | BOOLEAN | Indicates whether the order is tax exempt. |
channelcode | STRING | The code of the channel. |
customerinteractiontype | STRING | The type of customer interaction. |
fulfillmentinfo__auditinfo__createby | STRING | The user who created the fulfillment information. |
fulfillmentinfo__auditinfo__createdate | TIMESTAMP | The date when the fulfillment information was created. |
fulfillmentinfo__auditinfo__updateby | STRING | The user who last updated the fulfillment information. |
fulfillmentinfo__auditinfo__updatedate | TIMESTAMP | The date when the fulfillment information was last updated. |
fulfillmentinfo__shippingmethodcode | STRING | The code of the shipping method. |
fulfillmentinfo__fulfillmentcontact__address__address1 | STRING | The first line of the fulfillment contact’s address. |
fulfillmentinfo__fulfillmentcontact__address__cityortown | STRING | The city or town of the fulfillment contact’s address. |
fulfillmentinfo__fulfillmentcontact__address__stateorprovince | STRING | The state or province of the fulfillment contact’s address. |
fulfillmentinfo__fulfillmentcontact__address__postalorzipcode | STRING | The postal or zip code of the fulfillment contact’s address. |
fulfillmentinfo__fulfillmentcontact__address__countrycode | STRING | The country code of the fulfillment contact’s address. |
fulfillmentinfo__fulfillmentcontact__address__isvalidated | BOOLEAN | Indicates whether the fulfillment contact’s address is validated. |
fulfillmentinfo__fulfillmentcontact__address__address2 | STRING | The second line of the fulfillment contact’s address. |
fulfillmentinfo__fulfillmentcontact__address__addresstype | STRING | The address type of the fulfillment contact. |
fulfillmentinfo__fulfillmentcontact__address__address3 | STRING | The third line of the fulfillment contact’s address. |
fulfillmentinfo__fulfillmentcontact__address__address4 | STRING | The fourth line of the fulfillment contact’s address. |
fulfillmentinfo__fulfillmentcontact__email | STRING | The email address of the fulfillment contact. |
fulfillmentinfo__fulfillmentcontact__firstname | STRING | The first name of the fulfillment contact. |
fulfillmentinfo__fulfillmentcontact__lastnameorsurname | STRING | The last name or surname of the fulfillment contact. |
fulfillmentinfo__fulfillmentcontact__phonenumbers__home | STRING | The home phone number of the fulfillment contact. |
fulfillmentinfo__fulfillmentcontact__phonenumbers__mobile | STRING | The mobile phone number of the fulfillment contact. |
fulfillmentinfo__fulfillmentcontact__phonenumbers__work | STRING | The work phone number of the fulfillment contact. |
fulfillmentinfo__fulfillmentcontact__companyororganization | STRING | The company or organization of the fulfillment contact. |
fulfillmentinfo__fulfillmentcontact___id | INTEGER | The unique identifier of the fulfillment contact. |
fulfillmentinfo__fulfillmentcontact__middlenameorinitial | STRING | The middle name or initial of the fulfillment contact. |
fulfillmentinfo__shippingmethodname | STRING | The name of the shipping method. |
fulfillmentinfo__isdestinationcommercial | BOOLEAN | Indicates whether the destination is commercial. |
aggregatefeeamount | FLOAT | The aggregate amount of fees. |
dutyamount | FLOAT | The amount of duties. |
subtotal | FLOAT | The subtotal of the order. |
discounttotal | FLOAT | The total amount of discounts. |
shippingtotal | FLOAT | The total amount of shipping fees. |
taxtotal | FLOAT | The total amount of taxes. |
itemtaxtotal | FLOAT | The total amount of item taxes. |
shippingtaxtotal | FLOAT | The total amount of shipping taxes. |
handlingtaxtotal | FLOAT | The total amount of handling taxes. |
feetotal | FLOAT | The total amount of fees. |
total | FLOAT | The total amount of the order. |
submitteddate | TIMESTAMP | The date when the order was submitted. |
currencycode | STRING | The code of the currency. |
auditinfo__createby | STRING | The user who created the record. |
auditinfo__createdate | TIMESTAMP | The date when the record was created. |
auditinfo__updateby | STRING | The user who last updated the record. |
auditinfo__updatedate | TIMESTAMP | The date when the record was last updated. |
lastmodifieddate | TIMESTAMP | The date when the order was last modified. |
ordernumber | INTEGER | The number of the order. |
parentcheckoutnumber | INTEGER | The number of the parent checkout. |
partialordernumber | INTEGER | The number of the partial order. |
partialordercount | INTEGER | The count of partial orders. |
version | STRING | The version of the order. |
shoppernotes__comments | STRING | Comments from the shopper. |
shoppernotes__giftmessage | STRING | The gift message from the shopper. |
STRING | The email address. | |
ipaddress | STRING | The IP address of the customer. |
acceptsmarketing | BOOLEAN | Indicates whether the customer accepts marketing. |
confirmationsent | BOOLEAN | Indicates whether a confirmation was sent. |
pricelistcode | STRING | The code of the price list. |
totalcollected | FLOAT | The total amount collected. |
status | STRING | The status of the order. |
type | STRING | The type of order. |
fulfillmentstatus | STRING | The status of the fulfillment. |
paymentstatus | STRING | The status of the payment. |
returnstatus | STRING | The status of the return. |
billinginfo__paymenttype | STRING | The type of payment. |
billinginfo__paymentworkflow | STRING | The payment workflow used for the billing. |
billinginfo__billingcontact__address__address1 | STRING | The first line of the billing contact’s address. |
billinginfo__billingcontact__address__cityortown | STRING | The city or town of the billing contact’s address. |
billinginfo__billingcontact__address__stateorprovince | STRING | The state or province of the billing contact’s address. |
billinginfo__billingcontact__address__postalorzipcode | STRING | The postal or zip code of the billing contact’s address. |
billinginfo__billingcontact__address__countrycode | STRING | The country code of the billing contact’s address. |
billinginfo__billingcontact__address__addresstype | STRING | The address type of the billing contact. |
billinginfo__billingcontact__address__isvalidated | BOOLEAN | Indicates whether the billing contact’s address is validated. |
billinginfo__billingcontact__address__address2 | STRING | The second line of the billing contact’s address. |
billinginfo__billingcontact__address__address3 | STRING | The third line of the billing contact’s address. |
billinginfo__billingcontact__address__address4 | STRING | The fourth line of the billing contact’s address. |
billinginfo__billingcontact__email | STRING | The email address of the billing contact. |
billinginfo__billingcontact__firstname | STRING | The first name of the billing contact. |
billinginfo__billingcontact__lastnameorsurname | STRING | The last name or surname of the billing contact. |
billinginfo__billingcontact__phonenumbers__home | STRING | The home phone number of the billing contact. |
billinginfo__billingcontact__phonenumbers__mobile | STRING | The mobile phone number of the billing contact. |
billinginfo__billingcontact__phonenumbers__work | STRING | The work phone number of the billing contact. |
billinginfo__billingcontact___id | INTEGER | The unique identifier of the billing contact. |
billinginfo__billingcontact__companyororganization | STRING | The company or organization of the billing contact. |
billinginfo__billingcontact__middlenameorinitial | STRING | The middle name or initial of the billing contact. |
billinginfo__issamebillingshippingaddress | BOOLEAN | Indicates whether the billing and shipping addresses are the same. |
billinginfo__auditinfo__createby | STRING | The user who created the billing information. |
billinginfo__auditinfo__createdate | TIMESTAMP | The date when the billing information was created. |
billinginfo__auditinfo__updateby | STRING | The user who last updated the billing information. |
billinginfo__auditinfo__updatedate | TIMESTAMP | The date when the billing information was last updated. |
billinginfo__externaltransactionid | STRING | The external transaction identifier. |
billinginfo__card__nameoncard | STRING | The name on the credit card. |
billinginfo__card__paymentservicecardid | STRING | The identifier of the card in the payment service. |
billinginfo__card__paymentorcardtype | STRING | The payment or card type. |
billinginfo__card__iscardinfosaved | BOOLEAN | Indicates whether the card information is saved. |
billinginfo__card__isusedrecurring | BOOLEAN | Indicates whether the card is used for recurring payments. |
billinginfo__card__istokenized | BOOLEAN | Indicates whether the card is tokenized. |
billinginfo__card__cclastfour | STRING | The last four digits of the credit card. |
billinginfo__purchaseorder__paymentterm__code | STRING | The code of the payment term for the purchase order. |
billinginfo__purchaseorder__paymentterm__description | STRING | The description of the payment term for the purchase order. |
billinginfo__purchaseorder__purchaseordernumber | STRING | The purchase order number. |
billinginfo__check__checknumber | STRING | The check number. |
billinginfo__customcredittype | STRING | The type of custom credit used. |
billinginfo__storecreditcode | STRING | The store credit code. |
billinginfo__storecredittype | STRING | The type of store credit used. |
billinginfo__token__type | STRING | The type of token. |
billinginfo__token__paymentservicetokenid | STRING | The identifier of the token in the payment service. |
amountavailableforrefund | FLOAT | The amount available for refund. |
accepteddate | TIMESTAMP | The date when the order was accepted. |
isimport | BOOLEAN | Indicates whether the order is an import. |
ishistoricalimport | BOOLEAN | Indicates whether the order is a historical import. |
isunified | BOOLEAN | Indicates whether the order is unified. |
canbereopened | BOOLEAN | Indicates whether the order can be reopened. |
readytocapture | BOOLEAN | Indicates whether the order is ready to be captured. |
isoptinforsms | BOOLEAN | Indicates whether the customer is opted in for SMS. |
closeddate | TIMESTAMP | The date when the order was closed. |
importdate | TIMESTAMP | The date when the order was imported. |
externalid | STRING | The external identifier of the order. |
expirationdate | TIMESTAMP | The expiration date. |
adjustment__amount | STRING | The amount of the adjustment. |
adjustment__description | STRING | The description of the adjustment. |
adjustment__internalcomment | STRING | Internal comments related to the adjustment. |
lastvalidationdate | TIMESTAMP | The date of the last validation. |
shippingadjustment__amount | FLOAT | The amount of the shipping adjustment. |
shippingadjustment__description | STRING | The description of the shipping adjustment. |
shippingadjustment__internalcomment | STRING | Internal comments related to the shipping adjustment. |
appliedadjustment__amount | FLOAT | The amount of the applied adjustment. |
appliedadjustment__internalcomment | STRING | Internal comments related to the applied adjustment. |
handlingsubtotal | FLOAT | The subtotal for handling fees. |
handlingtotal | FLOAT | The total amount of handling fees. |
appliedshippingadjustment__amount | FLOAT | The amount of the applied shipping adjustment. |
appliedshippingadjustment__internalcomment | STRING | Internal comments related to the applied shipping adjustment. |
handlingadjustment__amount | FLOAT | The amount of the handling adjustment. |
handlingadjustment__description | STRING | The description of the handling adjustment. |
handlingadjustment__internalcomment | STRING | Internal comments related to the handling adjustment. |
appliedhandlingadjustment__amount | FLOAT | The amount of the applied handling adjustment. |
appliedhandlingadjustment__internalcomment | STRING | Internal comments related to the applied handling adjustment. |
customertaxid | STRING | The customer tax identifier. |
parentordernumber | INTEGER | The number of the parent order. |
parentreturnnumber | INTEGER | The number of the parent return. |
locationcode | STRING | The code of the location. |
continuityorderordinal | INTEGER | The ordinal number of the continuity order. |
_id | STRING | The unique identifier of the record. |
_sdc_updatedate_block | TIMESTAMP | The timestamp of the update date block. |
_sdc_deleted_at | TIMESTAMP | The timestamp when the record was deleted. |
_sdc_extracted_at | TIMESTAMP | The timestamp when the record was extracted. |
_sdc_received_at | TIMESTAMP | The timestamp when the record was received. |
_sdc_batched_at | TIMESTAMP | The timestamp when the record was batched. |
order_items
Field Name | Type | Description |
skipinventorycheck | BOOLEAN | Indicates if inventory check is skipped. |
_id | STRING | Unique identifier for the record. |
isrecurring | BOOLEAN | Indicates if the order item is recurring. |
dutyamount | FLOAT | Amount of duty applied to the order item. |
purchaselocation | STRING | Location where the purchase was made. |
lineid | INTEGER | Unique identifier for the line item. |
product__productcode | STRING | Unique code identifying the product. |
product__name | STRING | Name of the product. |
product__description | STRING | Description of the product. |
product__goodstype | STRING | Type of goods. |
product__stock__managestock | BOOLEAN | Indicates if stock is managed for the product. |
product__stock__availabledate | TIMESTAMP | Date when the product will be available. |
product__stock__allowsbackorder | BOOLEAN | Indicates if backorders are allowed for the product. |
product__stock__isonbackorder | BOOLEAN | Indicates if the product is on backorder. |
product__stock__stockavailable | INTEGER | Quantity of stock available for the product. |
product__stock__aggregateinventory | INTEGER | Aggregate inventory level of the product. |
product__measurements__height__unit | STRING | Unit of measurement for product height. |
product__measurements__height__value__string | STRING | String representation of the product height value. |
product__measurements__height__value__boolean | BOOLEAN | Boolean representation of the product height value. |
product__measurements__height__value__inst | TIMESTAMP | Timestamp representation of the product height value. |
product__measurements__height__value__double | FLOAT | Double representation of the product height value. |
product__measurements__height__value__bigint | INTEGER | Integer representation of the product height value. |
product__measurements__width__unit | STRING | Unit of measurement for product width. |
product__measurements__width__value | STRING | Value of the product width. |
product__measurements__length__unit | STRING | Unit of measurement for product length. |
product__measurements__length__value | STRING | Value of the product length. |
product__measurements__weight__unit | STRING | Unit of measurement for product weight. |
product__measurements__weight__value | STRING | Value of the product weight. |
product__ispackagedstandalone | BOOLEAN | Indicates if the product is packaged standalone. |
product__fulfillmentstatus | STRING | Fulfillment status of the product. |
product__mfgpartnumber | STRING | Manufacturer part number of the product. |
product__upc | STRING | Universal product code of the product. |
product__imagealternatetext | STRING | Alternate text for the product image. |
product__imageurl | STRING | URL of the product image. |
product__price__price | FLOAT | Price of the product. |
product__price__creditvalue | STRING | Credit value associated with the product price. |
product__price__msrp | STRING | Manufacturer’s suggested retail price of the product. |
product__price__pricelistcode | STRING | Code identifying the price list for the product. |
product__price__pricelistentrymode | STRING | Price list entry mode of the product. |
product__price__saleprice | FLOAT | Sale price of the product. |
product__price__tenantoverrideprice | FLOAT | Tenant overridden price of the product. |
product__price__isoverridepricesalesprice | BOOLEAN | Indicates if the sale price is overridden. |
product__discountsrestricted | BOOLEAN | Indicates if discounts are restricted for the product. |
product__istaxable | BOOLEAN | Indicates if the product is taxable. |
product__producttype | STRING | Type of product. |
product__productusage | STRING | Usage type of the product. |
product__sku | STRING | Stock keeping unit of the product. |
product__variationproductcode | STRING | Code identifying the product variation. |
product__productreservationid | INTEGER | Identifier for product reservation. |
product__discountsrestrictedstartdate | TIMESTAMP | Date when discount restrictions start for the product. |
product__isrecurring | BOOLEAN | Indicates if the product is recurring. |
quantity | INTEGER | Quantity of the product in the order item. |
unitprice__listamount | FLOAT | List amount of the unit price. |
unitprice__extendedamount | FLOAT | Extended amount of the unit price. |
unitprice__discountappliestosaleprice | BOOLEAN | Indicates if the discount applies to the sale price. |
unitprice__producthasdiscount | BOOLEAN | Indicates if the product has a discount applied. |
unitprice__saleamount | FLOAT | Sale amount of the unit price. |
unitprice__overrideamount | FLOAT | Overridden unit price amount. |
taxdata__source | STRING | Source of the tax data. |
taxdata__taxareaid | STRING | Identifier for the tax area. |
taxdata__itemtax | STRING | Tax amount for the item. |
subtotal | FLOAT | Subtotal amount for the order item. |
extendedtotal | FLOAT | Extended total price for the order item. |
discounttotal | FLOAT | Total discount amount for the order item. |
taxabletotal | FLOAT | Total taxable amount for the order item. |
itemtaxtotal | FLOAT | Total tax amount for the order item. |
shippingtaxtotal | FLOAT | Total shipping tax amount. |
shippingtotal | FLOAT | Total shipping cost for the order item. |
feetotal | FLOAT | Total fees for the order item. |
total | FLOAT | Total amount for the order item. |
auditinfo__createby | STRING | User who created the record. |
auditinfo__createdate | TIMESTAMP | Timestamp when the record was created. |
auditinfo__updateby | STRING | User who last updated the record. |
auditinfo__updatedate | TIMESTAMP | Timestamp when the record was last updated. |
shippingamountbeforediscountsandadjustments | STRING | Shipping amount before discounts and adjustments. |
weightedorderdiscount | STRING | Weighted order discount amount. |
adjustedlineitemsubtotal | STRING | Adjusted subtotal for the line item. |
weightedordertax | STRING | Weighted order tax amount. |
totalwithoutweightedshippingandhandling | STRING | Total amount without weighted shipping and handling. |
weightedordershipping | STRING | Weighted order shipping cost. |
weightedordershippingdiscount | STRING | Weighted order shipping discount amount. |
weightedordershippingmanualadjustment | STRING | Weighted order shipping manual adjustment amount. |
weightedordershippingtax | STRING | Weighted order shipping tax amount. |
weightedorderhandlingfee | STRING | Weighted order handling fee. |
weightedorderhandlingfeetax | STRING | Weighted order handling fee tax amount. |
weightedorderhandlingfeediscount | STRING | Weighted order handling fee discount amount. |
weightedorderduty | STRING | Weighted order duty amount. |
totalwithweightedshippingandhandling | STRING | Total amount with weighted shipping and handling. |
weightedorderhandlingadjustment | FLOAT | Weighted order handling adjustment amount. |
isassemblyrequired | BOOLEAN | Indicates if the product requires assembly. |
originalcartitemid | STRING | Identifier of the original cart item. |
fulfillmentlocationcode | STRING | Code of the fulfillment location. |
fulfillmentmethod | STRING | Method used for fulfilling the order item. |
weightedorderadjustment | STRING | Weighted order adjustment amount. |
handlingamount | FLOAT | Handling amount for the order item. |
destinationid | STRING | Identifier for the destination. |
istaxable | BOOLEAN | Indicates if the order item is taxable. |
autoadddiscountid | INTEGER | Identifier for automatically added discounts. |
expecteddeliverydate | TIMESTAMP | Date when the order item is expected to be delivered. |
parentitemid | STRING | Identifier of the parent item. |
localecode | STRING | Locale code. |
pricemode | STRING | Mode of pricing. |
_sdc_source_key__id | STRING | Unique identifier from the source system. |
_sdc_source_updatedate_block | TIMESTAMP | Timestamp block of the last update in the source system. |
_sdc_source_updatedate | TIMESTAMP | Timestamp of the last update in the source system. |
_sdc_source_tenant | INTEGER | Tenant identifier from the source system. |
_sdc_level_0_id | INTEGER | Level 0 identifier. |
_sdc_deleted_at | TIMESTAMP | Timestamp when the data was deleted. |
_sdc_extracted_at | TIMESTAMP | Timestamp when the data was extracted. |
_sdc_received_at | TIMESTAMP | Timestamp when the data was received. |
_sdc_batched_at | TIMESTAMP | Timestamp when the data was batched. |
_sdc_sequence | INTEGER | Sequence number of the record. |
_sdc_table_version | INTEGER | Version number of the table schema. |
order_attributes
Field Name | Type | Description |
visitid | STRING | Identifier for the visit. |
websessionid | STRING | Identifier for the web session. |
_id | STRING | Unique identifier for the record. |
attributedefinitionid | INTEGER | Identifier for the attribute definition. |
fullyqualifiedname | STRING | Fully qualified name of the attribute. |
datatype | INTEGER | Integer representing the data type of the attribute. |
auditinfo__createdate | TIMESTAMP | Timestamp indicating when the record was created. |
auditinfo__updatedate | TIMESTAMP | Timestamp indicating when the record was last updated. |
_sdc_source_key__id | STRING | Source system identifier for the record. |
_sdc_source_updatedate_block | TIMESTAMP | Timestamp block for source update. |
_sdc_source_updatedate | TIMESTAMP | Timestamp indicating when the source data was last updated. |
_sdc_source_tenant | INTEGER | Identifier for the source tenant. |
_sdc_level_0_id | INTEGER | Level 0 identifier. |
_sdc_extracted_at | TIMESTAMP | Timestamp indicating when the record was extracted. |
_sdc_deleted_at | TIMESTAMP | Timestamp indicating when the record was marked as deleted. |
_sdc_received_at | TIMESTAMP | Timestamp indicating when the record was received. |
_sdc_batched_at | TIMESTAMP | Timestamp indicating when the record was batched. |
_sdc_sequence | INTEGER | Sequence number for the record. |
_sdc_table_version | INTEGER | Version number of the table. |
shipment
Field Name | Type | Description |
signaturerequired | BOOLEAN | A boolean indicating whether a signature is required for delivery. |
originalorderid | STRING | The identifier of the original order. |
isautoassigned | BOOLEAN | A boolean indicating whether the shipment was automatically assigned. |
ishistoricalimport | BOOLEAN | A boolean indicating whether the record is a historical import. |
parentcheckoutnumber | INTEGER | The checkout number of the parent checkout. |
versionhash | STRING | A hash representing the version of the record. |
shipmentnumber | INTEGER | The unique identifier for the shipment. |
ordernumber | INTEGER | The number assigned to the order. |
ordersubmitdate | TIMESTAMP | The date when the order was submitted. |
orderid | STRING | The identifier of the order. |
customeraccountid | INTEGER | The identifier for the customer account. |
tenantid | INTEGER | The identifier for the tenant. |
siteid | INTEGER | The identifier for the site associated with the shipment. |
fulfillmentlocationcode | STRING | The code of the location where the shipment is being fulfilled. |
assignedlocationcode | STRING | The code of the location assigned to the shipment. |
shipmenttype | STRING | The type of shipment. |
shipmentstatus | STRING | The current status of the shipment. |
workflowprocessid | STRING | The identifier for the workflow process. |
workflowprocesscontainerid | STRING | The identifier for the workflow process container. |
shipmentadjustment | FLOAT | An adjustment amount applied to the shipment. |
lineitemsubtotal | FLOAT | The subtotal for the line items in the shipment. |
lineitemtaxadjustment | FLOAT | An adjustment amount applied to the line item tax. |
lineitemtaxtotal | FLOAT | The total tax amount for the line items in the shipment. |
lineitemtotal | FLOAT | The total cost of the line items in the shipment. |
shippingadjustment | FLOAT | An adjustment amount applied to the shipping cost. |
shippingsubtotal | FLOAT | The subtotal for shipping costs. |
shippingtaxadjustment | FLOAT | An adjustment amount applied to the shipping tax. |
shippingtaxtotal | FLOAT | The total tax amount for shipping. |
shippingtotal | FLOAT | The total shipping cost for the shipment. |
handlingadjustment | FLOAT | An adjustment amount applied to the handling cost. |
handlingsubtotal | FLOAT | The subtotal for handling costs. |
handlingtaxadjustment | FLOAT | An adjustment amount applied to the handling tax. |
handlingtaxtotal | FLOAT | The total tax amount for handling. |
handlingtotal | FLOAT | The total handling cost for the shipment. |
dutyadjustment | FLOAT | An adjustment amount applied to the duty. |
dutytotal | FLOAT | The total duty amount for the shipment. |
total | FLOAT | The total cost of the shipment. |
currencycode | STRING | The code of the currency used for the shipment. |
destination__destinationcontact__address__address1 | STRING | The first line of the destination contact’s address. |
destination__destinationcontact__address__addresstype | STRING | The type of address for the destination contact. |
destination__destinationcontact__address__cityortown | STRING | The city or town of the destination contact’s address. |
destination__destinationcontact__address__countrycode | STRING | The country code of the destination contact’s address. |
destination__destinationcontact__address__isvalidated | BOOLEAN | A boolean indicating whether the destination contact’s address is validated. |
destination__destinationcontact__address__postalorzipcode | STRING | The postal or zip code of the destination contact’s address. |
destination__destinationcontact__address__stateorprovince | STRING | The state or province of the destination contact’s address. |
destination__destinationcontact__address__address2 | STRING | The second line of the destination contact’s address. |
destination__destinationcontact__address__address3 | STRING | The third line of the destination contact’s address. |
destination__destinationcontact__address__address4 | STRING | The fourth line of the destination contact’s address. |
destination__destinationcontact__address__latitude | STRING | The latitude of the destination contact’s address. |
destination__destinationcontact__address__longitude | STRING | The longitude of the destination contact’s address. |
destination__destinationcontact__email | STRING | The email address of the destination contact. |
destination__destinationcontact__firstname | STRING | The first name of the destination contact. |
destination__destinationcontact__lastnameorsurname | STRING | The last name or surname of the destination contact. |
destination__destinationcontact__shortfullname | STRING | The shortened full name of the destination contact. |
destination__destinationcontact__fullname | STRING | The full name of the destination contact. |
destination__destinationcontact__phonenumbers__home | STRING | The home phone number of the destination contact. |
destination__destinationcontact__phonenumbers__mobile | STRING | The mobile phone number of the destination contact. |
destination__destinationcontact__phonenumbers__work | STRING | The work phone number of the destination contact. |
destination__destinationcontact___id | INTEGER | The identifier for the destination contact. |
destination__destinationcontact__companyororganization | STRING | The company or organization name of the destination contact. |
destination__destinationcontact__middlenameorinitial | STRING | The middle name or initial of the destination contact. |
destination__isdestinationcommercial | BOOLEAN | A boolean indicating whether the destination is a commercial address. |
destination__locationcode | STRING | The location code of the destination. |
customer__customercontact__address__address1 | STRING | The first line of the customer’s contact address. |
customer__customercontact__address__addresstype | STRING | The type of address for the customer contact. |
customer__customercontact__address__cityortown | STRING | The city or town of the customer’s contact address. |
customer__customercontact__address__countrycode | STRING | The country code of the customer’s contact address. |
customer__customercontact__address__isvalidated | BOOLEAN | A boolean indicating whether the customer’s contact address is validated. |
customer__customercontact__address__postalorzipcode | STRING | The postal or zip code of the customer’s contact address. |
customer__customercontact__address__stateorprovince | STRING | The state or province of the customer’s contact address. |
customer__customercontact__address__address2 | STRING | The second line of the customer’s contact address. |
customer__customercontact__address__address3 | STRING | The third line of the customer’s contact address. |
customer__customercontact__address__address4 | STRING | The fourth line of the customer’s contact address. |
customer__customercontact__email | STRING | The email address of the customer contact. |
customer__customercontact__firstname | STRING | The first name of the customer contact. |
customer__customercontact__lastnameorsurname | STRING | The last name or surname of the customer contact. |
customer__customercontact__shortfullname | STRING | The shortened full name of the customer contact. |
customer__customercontact__fullname | STRING | The full name of the customer contact. |
customer__customercontact__phonenumbers__home | STRING | The home phone number of the customer contact. |
customer__customercontact__phonenumbers__mobile | STRING | The mobile phone number of the customer contact. |
customer__customercontact__phonenumbers__work | STRING | The work phone number of the customer contact. |
customer__customercontact___id | INTEGER | The identifier for the customer contact. |
customer__customercontact__companyororganization | STRING | The company or organization name of the customer contact. |
customer__customercontact__middlenameorinitial | STRING | The middle name or initial of the customer contact. |
workflowstate__shipmentstate | STRING | The state of the shipment in the workflow. |
workflowstate__processinstanceid | STRING | The identifier for the workflow process instance. |
workflowstate__auditinfo__updatedate | TIMESTAMP | The timestamp when the workflow state was last updated. |
workflowstate__auditinfo__createdate | TIMESTAMP | The timestamp when the workflow state was created. |
workflowstate__auditinfo__updateby | STRING | The user who last updated the workflow state. |
workflowstate__auditinfo__createby | STRING | The user who created the workflow state. |
workflowstate__variables__initiator__name | STRING | The name of the initiator variable in the workflow state. |
workflowstate__variables__initiator__oldvalue | STRING | The previous value of the initiator variable in the workflow state. |
workflowstate__variables__initiator__value | STRING | The value of the initiator variable in the workflow state. |
workflowstate__variables__initiator__updatedate | TIMESTAMP | The timestamp when the initiator variable in the workflow state was last updated. |
workflowstate__variables__currentstate__name | STRING | The name of the current state variable in the workflow state. |
workflowstate__variables__currentstate__oldvalue | STRING | The previous value of the current state variable in the workflow state. |
workflowstate__variables__currentstate__value | STRING | The value of the current state variable in the workflow state. |
workflowstate__variables__currentstate__updatedate | TIMESTAMP | The timestamp when the current state variable in the workflow state was last updated. |
workflowstate__variables__assemblyrequired__name | STRING | The name of the assembly required variable in the workflow state. |
workflowstate__variables__assemblyrequired__oldvalue | STRING | The previous value of the assembly required variable in the workflow state. |
workflowstate__variables__assemblyrequired__value | STRING | The value of the assembly required variable in the workflow state. |
workflowstate__variables__assemblyrequired__updatedate | TIMESTAMP | The timestamp when the assembly required variable in the workflow state was last updated. |
workflowstate__variables__back__name | STRING | The name of the back variable in the workflow state. |
workflowstate__variables__back__oldvalue | STRING | The previous value of the back variable in the workflow state. |
workflowstate__variables__back__value | STRING | The value of the back variable in the workflow state. |
workflowstate__variables__back__updatedate | TIMESTAMP | The timestamp when the back variable in the workflow state was last updated. |
workflowstate__variables__shipmentaccepted__name | STRING | The name of the shipment accepted variable in the workflow state. |
workflowstate__variables__shipmentaccepted__oldvalue | STRING | The previous value of the shipment accepted variable in the workflow state. |
workflowstate__variables__shipmentaccepted__value | STRING | The value of the shipment accepted variable in the workflow state. |
workflowstate__variables__shipmentaccepted__updatedate | TIMESTAMP | The timestamp when the shipment accepted variable in the workflow state was last updated. |
workflowstate__variables__stocklevel__name | STRING | The name of the stock level variable in the workflow state. |
workflowstate__variables__stocklevel__oldvalue | STRING | The previous value of the stock level variable in the workflow state. |
workflowstate__variables__stocklevel__value | STRING | The value of the stock level variable in the workflow state. |
workflowstate__variables__stocklevel__updatedate | TIMESTAMP | The timestamp when the stock level variable in the workflow state was last updated. |
workflowstate__variables__canceled__name | STRING | The name of the canceled variable in the workflow state. |
workflowstate__variables__canceled__oldvalue | STRING | The previous value of the canceled variable in the workflow state. |
workflowstate__variables__canceled__value | STRING | The value of the canceled variable in the workflow state. |
workflowstate__variables__canceled__updatedate | TIMESTAMP | The timestamp when the canceled variable in the workflow state was last updated. |
workflowstate__variables__customeraccepted__name | STRING | The name of the customer accepted variable in the workflow state. |
workflowstate__variables__customeraccepted__oldvalue | STRING | The previous value of the customer accepted variable in the workflow state. |
workflowstate__variables__customeraccepted__value | STRING | The value of the customer accepted variable in the workflow state. |
workflowstate__variables__customeraccepted__updatedate | TIMESTAMP | The timestamp when the customer accepted variable in the workflow state was last updated. |
workflowstate__variables__createtransfer__name | STRING | The name of the create transfer variable in the workflow state. |
workflowstate__variables__createtransfer__oldvalue | STRING | The previous value of the create transfer variable in the workflow state. |
workflowstate__variables__createtransfer__value | STRING | The value of the create transfer variable in the workflow state. |
workflowstate__variables__createtransfer__updatedate | TIMESTAMP | The timestamp when the create transfer variable in the workflow state was last updated. |
workflowstate__variables__assemblycompleted__name | STRING | The name of the assembly completed variable in the workflow state. |
workflowstate__variables__assemblycompleted__oldvalue | STRING | The previous value of the assembly completed variable in the workflow state. |
workflowstate__variables__assemblycompleted__value | STRING | The value of the assembly completed variable in the workflow state. |
workflowstate__variables__assemblycompleted__updatedate | TIMESTAMP | The timestamp when the assembly completed variable in the workflow state was last updated. |
workflowstate__activetaskname | STRING | The name of the active task in the workflow state. |
STRING | The email address associated with the shipment. | |
auditinfo__updatedate | TIMESTAMP | The timestamp when the record was last updated. |
auditinfo__createdate | TIMESTAMP | The timestamp when the record was created. |
auditinfo__updateby | STRING | The user who last updated the record. |
auditinfo__createby | STRING | The user who created the record. |
lastmodifieddate | TIMESTAMP | The date when the shipment was last modified. |
readytocapture | BOOLEAN | A boolean indicating whether the shipment is ready to be captured. |
isoptinforsms | BOOLEAN | A boolean indicating whether the customer has opted in for SMS notifications. |
shoppernotes__comments | STRING | Additional comments provided by the shopper. |
shoppernotes__giftmessage | STRING | A gift message provided by the shopper. |
shoppernotes__deliveryinstructions | STRING | Delivery instructions provided by the shopper. |
_class | STRING | The class or type of the record. |
externalorderid | STRING | The external identifier of the order. |
fulfillmentdate | TIMESTAMP | The date when the shipment was fulfilled. |
fulfillmentstatus | STRING | The current status of the fulfillment process. |
shippingmethodcode | STRING | The code of the shipping method used. |
datajson | STRING | A JSON string containing additional data related to the shipment. |
accepteddate | TIMESTAMP | The date when the shipment was accepted. |
isexpress | BOOLEAN | A boolean indicating whether the shipment is an express shipment. |
originalshipmentnumber | INTEGER | The shipment number of the original shipment. |
parentshipmentnumber | INTEGER | The shipment number of the parent shipment. |
shippingmethodname | STRING | The name of the shipping method used. |
picktype | STRING | The type of pick associated with the shipment. |
shipmentstatusreason__reasoncode | STRING | The code representing the reason for the shipment status. |
shipmentstatusreason__moreinfo | STRING | Additional information about the reason for the shipment status. |
readyforpickup | BOOLEAN | A boolean indicating whether the shipment is ready for pickup. |
readyforpickupdate | TIMESTAMP | The date when the shipment is ready for pickup. |
appeasementreason__reasoncode | STRING | The code representing the reason for appeasement. |
appeasementreason__moreinfo | STRING | Additional information about the reason for appeasement. |
receiveddate | TIMESTAMP | The date when the shipment was received. |
deleted | BOOLEAN | A boolean indicating whether the shipment is deleted. |
deleteddate | TIMESTAMP | The date when the shipment was deleted. |
pickwavenumber | INTEGER | The number of the pick wave associated with the shipment. |
pickstatus | STRING | The status of the picking process for the shipment. |
taxdata__ordertax | STRING | The tax amount for the order. |
taxdata__taxareaid | STRING | The identifier for the tax area. |
taxdata__source | STRING | The source of the tax data. |
_id | STRING | A unique identifier for the shipment record. |
_sdc_updatedate_block | TIMESTAMP | The timestamp indicating the block of updates. |
_sdc_received_at | TIMESTAMP | The timestamp when the record was received. |
_sdc_batched_at | TIMESTAMP | The timestamp when the record was batched. |
_sdc_deleted_at | TIMESTAMP | The timestamp when the record was marked as deleted. |
_sdc_extracted_at | TIMESTAMP | The timestamp when the record was extracted. |
_sdc_table_version | INTEGER | The version of the table. |
_sdc_sequence | INTEGER | A sequence number, potentially used for tracking changes. |
shipment_items
Field Name | Type | Description |
fulfillmentitemtype | STRING | Type of fulfillment for the item. |
parentid | STRING | Identifier of the parent item. |
lineid | INTEGER | Identifier for the line item in the shipment. |
quantity | INTEGER | Quantity of the item in the shipment. |
transferquantity | INTEGER | Quantity of the item being transferred. |
auditinfo__updatedate | TIMESTAMP | Timestamp indicating when the audit information was last updated. |
auditinfo__createdate | TIMESTAMP | Timestamp indicating when the audit information was created. |
auditinfo__updateby | STRING | User or system that last updated the audit information. |
auditinfo__createby | STRING | User or system that created the audit information. |
auditinfo___class | STRING | Class information related to auditing. |
_id | STRING | Unique identifier for the item. |
originalorderitemid | STRING | Identifier of the original order item. |
goodstype | STRING | Type of goods for the item. |
productcode | STRING | Code for the product. |
imageurl | STRING | URL of the image for the item. |
name | STRING | Name of the item. |
partnumber | STRING | Part number of the item. |
upc | STRING | Universal product code for the item. |
allowsbackorder | BOOLEAN | Boolean value indicating whether backorders are allowed for the item. |
unitprice | FLOAT | Unit price of the item. |
istaxable | BOOLEAN | Boolean value indicating whether the item is taxable. |
actualprice | FLOAT | Actual price of the item. |
itemdiscount | FLOAT | Discount amount for the item. |
lineitemcost | FLOAT | Cost of the line item. |
itemtax | FLOAT | Tax amount for the item. |
shipping | FLOAT | Shipping cost associated with the item. |
shippingdiscount | FLOAT | Discount amount for shipping. |
shippingtax | FLOAT | Tax amount for shipping. |
handling | FLOAT | Handling cost associated with the item. |
handlingdiscount | FLOAT | Discount amount for handling. |
handlingtax | FLOAT | Tax amount for handling. |
duty | FLOAT | Duty amount for the item. |
weightedshipmentadjustment | FLOAT | Weighted adjustment to the shipment. |
weightedlineitemtaxadjustment | FLOAT | Weighted adjustment to the line item tax. |
weightedshippingadjustment | FLOAT | Weighted adjustment to the shipping cost. |
weightedshippingtaxadjustment | FLOAT | Weighted adjustment to the shipping tax. |
weightedhandlingadjustment | FLOAT | Weighted adjustment to the handling cost. |
weightedhandlingtaxadjustment | FLOAT | Weighted adjustment to the handling tax. |
weighteddutyadjustment | FLOAT | Weighted adjustment to the duty amount. |
taxableshipping | FLOAT | Amount of shipping cost that is taxable. |
taxablelineitemcost | FLOAT | Cost of the line item that is taxable. |
taxablehandling | FLOAT | Amount of handling cost that is taxable. |
weight | FLOAT | Weight of the item. |
weightunit | STRING | Unit of measurement for the item’s weight. |
datajson | STRING | JSON data containing additional information about the item. |
managestock | BOOLEAN | Boolean value indicating whether stock is managed for the item. |
creditvalue | FLOAT | Credit value associated with the item. |
isassemblyrequired | BOOLEAN | Boolean value indicating whether assembly is required for the item. |
ispackagedstandalone | BOOLEAN | Boolean value indicating whether the item is packaged standalone. |
sku | STRING | Stock keeping unit for the item. |
optionattributefqn | STRING | Fully qualified name of the option attribute. |
truetransferquantity | INTEGER | True quantity of the item being transferred. |
readyforpickupquantity | INTEGER | Quantity of the item that is ready for pickup. |
variationproductcode | STRING | Code for the variation of the product. |
locatorname | STRING | Name of the location where the item is stored or located. |
parentitemid | STRING | Identifier of the parent item. |
expecteddeliverydate | TIMESTAMP | Timestamp indicating the expected delivery date for the item. |
allocatedquantity | INTEGER | Quantity of the item that has been allocated. |
backorderreleasedate | TIMESTAMP | Timestamp indicating when a backorder for the item was released. |
overrideprice | FLOAT | Overridden price of the item. |
appeasementreason__reasoncode | STRING | Code for the reason for appeasement. |
appeasementreason__moreinfo | STRING | Additional information about the reason for appeasement related to the item. |
taxdata__source | STRING | Source of the tax data. |
taxdata__taxareaid | STRING | Identifier for the tax area. |
_sdc_source_key__id | STRING | Source key identifier for the item. |
_sdc_source_updatedate_block | TIMESTAMP | Timestamp block indicating when the item data was last updated in the source system. |
_sdc_source_updatedate | TIMESTAMP | Timestamp indicating when the item data was last updated in the source system. |
_sdc_source_tenant | INTEGER | Tenant identifier for the source system. |
_sdc_level_0_id | INTEGER | ID at the 0th level of a hierarchy, potentially related to data integration. |
_sdc_received_at | TIMESTAMP | Timestamp indicating when the item data was received. |
_sdc_batched_at | TIMESTAMP | Timestamp indicating when the item data was batched. |
_sdc_deleted_at | TIMESTAMP | Timestamp indicating when the item data was deleted. |
_sdc_extracted_at | TIMESTAMP | Timestamp indicating when the item data was extracted. |
_sdc_table_version | INTEGER | Version number of the table. |
_sdc_sequence | INTEGER | Sequence number for the item data. |
shipment_items_data
Field Name | Type | Description |
name | STRING | Name of the shipment item. |
_sdc_source_key__id | STRING | Unique identifier from the source system. |
_sdc_source_updatedate_block | TIMESTAMP | Timestamp block of the last update in the source system. |
_sdc_source_updatedate | TIMESTAMP | Timestamp indicating when the record was last updated in the source system. |
_sdc_source_tenant | INTEGER | Identifier for the source tenant. |
_sdc_level_0_id | INTEGER | Level 0 identifier for hierarchical data. |
_sdc_level_1_id | INTEGER | Level 1 identifier for hierarchical data. |
_sdc_batched_at | TIMESTAMP | Timestamp indicating when the data was batched. |
_sdc_received_at | TIMESTAMP | Timestamp indicating when the data was received. |
_sdc_deleted_at | TIMESTAMP | Timestamp indicating when the record was marked as deleted. |
_sdc_extracted_at | TIMESTAMP | Timestamp indicating when the data was extracted. |
_sdc_sequence | INTEGER | Sequence number of the record. |
_sdc_table_version | INTEGER | Version number of the table schema. |
shipment_items_data_values
Field Name | Type | Description |
value__string | STRING | Value represented as a string. |
value__boolean | BOOLEAN | Value represented as a boolean (true/false). |
value__inst | TIMESTAMP | Value represented as a timestamp. |
value__double | FLOAT | Numerical value represented as a double-precision floating-point number. |
value__bigint | INTEGER | Numerical value represented as a big integer. |
_sdc_source_key__id | STRING | Unique identifier from the source system. |
_sdc_source_updatedate_block | TIMESTAMP | Timestamp representing a block of updates from the source system. |
_sdc_source_updatedate | TIMESTAMP | Timestamp indicating when the data was updated in the source system. |
_sdc_source_tenant | INTEGER | Identifier for the source tenant. |
_sdc_level_0_id | INTEGER | Identifier for the level 0 hierarchy. |
_sdc_level_1_id | INTEGER | Identifier for the level 1 hierarchy. |
_sdc_level_2_id | INTEGER | Identifier for the level 2 hierarchy. |
_sdc_batched_at | TIMESTAMP | Timestamp indicating when the data was batched. |
_sdc_received_at | TIMESTAMP | Timestamp indicating when the data was received. |
_sdc_deleted_at | TIMESTAMP | Timestamp indicating when the data was marked as deleted. |
_sdc_extracted_at | TIMESTAMP | Timestamp indicating when the data was extracted. |
_sdc_sequence | INTEGER | Sequence number for change data capture. |
_sdc_table_version | INTEGER | Version number of the table schema or data. |
shipment_data
Field Name | Type | Description |
name | STRING | Name associated with the shipment. |
_sdc_source_key__id | STRING | Unique identifier from the source system for a given record. |
_sdc_source_updatedate_block | TIMESTAMP | Timestamp representing a block or batch of updates from the source system. |
_sdc_source_updatedate | TIMESTAMP | Timestamp indicating when the record was last updated in the source system. |
_sdc_source_tenant | INTEGER | Identifier for the source tenant. |
_sdc_level_0_id | INTEGER | Level 0 identifier. |
_sdc_batched_at | TIMESTAMP | Timestamp indicating when the data was batched for processing. |
_sdc_received_at | TIMESTAMP | Timestamp indicating when the data was received. |
_sdc_deleted_at | TIMESTAMP | Timestamp indicating when a record was marked as deleted. |
_sdc_extracted_at | TIMESTAMP | Timestamp indicating when the data was extracted from the source. |
_sdc_sequence | INTEGER | Sequence number, potentially used for ordering or tracking changes. |
_sdc_table_version | INTEGER | Version number of the table schema or data. |
shipment_data_values
Field Name | Type | Description |
value__string | STRING | String representation of a value. |
value__boolean | BOOLEAN | Boolean representation of a value. |
value__inst | TIMESTAMP | Timestamp representation of a value. |
value__double | FLOAT | Double representation of a value. |
value__bigint | INTEGER | Big integer representation of a value. |
_sdc_source_key__id | STRING | Identifier from the source system. |
_sdc_source_updatedate_block | TIMESTAMP | Timestamp indicating the block when the data was last updated in the source. |
_sdc_source_updatedate | TIMESTAMP | Timestamp indicating when the data was last updated in the source. |
_sdc_source_tenant | INTEGER | Identifier for the source tenant. |
_sdc_level_0_id | INTEGER | Level 0 identifier. |
_sdc_level_1_id | INTEGER | Level 1 identifier. |
_sdc_batched_at | TIMESTAMP | Timestamp indicating when the data was batched. |
_sdc_received_at | TIMESTAMP | Timestamp indicating when the data was received. |
_sdc_deleted_at | TIMESTAMP | Timestamp indicating when the data was marked as deleted. |
_sdc_extracted_at | TIMESTAMP | Timestamp indicating when the data was extracted. |
_sdc_sequence | INTEGER | Sequence number of the data record. |
_sdc_table_version | INTEGER | Version number of the table. |
shipment_packages
Field Name | Type | Description |
signaturerequired | BOOLEAN | Indicates whether a signature is required upon delivery of the package. |
_id | STRING | Unique identifier for the record. |
carrier | STRING | Name of the carrier for the package. |
auditinfo__updatedate | TIMESTAMP | Timestamp indicating when the package information was last updated. |
auditinfo__createdate | TIMESTAMP | Timestamp indicating when the package information was initially created. |
auditinfo__updateby | STRING | User or system that last updated the package information. |
attributes__carriertypeother | STRING | Additional information about the carrier type, if applicable. |
attributes__deliverytype | STRING | Type of delivery service used for the package. |
attributes__transittime | STRING | Estimated transit time for the package. |
attributes__carriertype | STRING | Type of carrier used for the package. |
attributes__trackingnumber | STRING | Tracking number for the package. |
attributes__trackingurl | STRING | URL for tracking the package. |
measurements__height__unit | STRING | Unit of measurement for the height of the package. |
measurements__height__value | FLOAT | Numerical value representing the height of the package. |
measurements__length__unit | STRING | Unit of measurement for the length of the package. |
measurements__length__value | FLOAT | Numerical value representing the length of the package. |
measurements__width__unit | STRING | Unit of measurement for the width of the package. |
measurements__width__value | FLOAT | Numerical value representing the width of the package. |
measurements__weight__unit | STRING | Unit of measurement for the weight of the package. |
measurements__weight__value | FLOAT | Numerical value representing the weight of the package. |
packagingtype | STRING | Type of packaging used for the package. |
packageId | STRING | Unique identifier for the package. |
shippingmethodcode | STRING | Code representing the shipping method used for the package. |
shippingmethodname | STRING | Name of the shipping method used for the package. |
stringbarcode | STRING | Barcode associated with the package, represented as a string. |
integratorid | STRING | Identifier for the system or service that integrated the package data. |
manifestid | STRING | Identifier for the manifest associated with the package. |
fxcbdocumentsurl | STRING | URL to documents related to the package. |
fxcbpacknotificationid | STRING | Identifier for the package notification. |
haslabel | BOOLEAN | Indicates whether the package has a shipping label. |
labelFormat | STRING | Format of the shipping label used for the package. |
packingslipnumber | INTEGER | Number of the packing slip associated with the package. |
returnCarrier | STRING | Carrier responsible for handling returns of the package. |
_sdc_source_key__id | STRING | Source system identifier for the package. |
_sdc_source_updatedate_block | TIMESTAMP | Timestamp indicating the block of updates from the source system. |
_sdc_source_updatedate | TIMESTAMP | Timestamp indicating when the package information was last updated in the source system. |
_sdc_source_tenant | INTEGER | Identifier for the source tenant. |
_sdc_level_0_id | INTEGER | System-generated identifier for the package at level 0. |
_sdc_extracted_at | TIMESTAMP | Timestamp indicating when the package information was extracted. |
_sdc_received_at | TIMESTAMP | Timestamp indicating when the package information was received by the system. |
_sdc_deleted_at | TIMESTAMP | Timestamp indicating when the package information was marked as deleted. |
_sdc_batched_at | TIMESTAMP | Timestamp indicating when the package information was batched. |
_sdc_table_version | INTEGER | Version number of the table schema. |
_sdc_sequence | INTEGER | Sequence number for the package information. |
locations
Field Name | Type | Description |
tenantid | INTEGER | Unique identifier for the tenant. |
code | STRING | Location code. |
name | STRING | Name of the location. |
address__address1 | STRING | First line of the address. |
address__address4 | STRING | Fourth line of the address. |
address__cityortownlower | STRING | Lowercase version of the city or town. |
address__cityortown | STRING | City or town of the address. |
address__stateorprovince | STRING | State or province of the address. |
address__stateorprovincelower | STRING | Lowercase version of the state or province. |
address__postalorzipcode | STRING | Postal or zip code of the address. |
address__postalorzipcodelower | STRING | Lowercase version of the postal or zip code. |
address__countrycode | STRING | Country code of the address. |
address__countrycodelower | STRING | Lowercase version of the country code. |
address__addresstype | STRING | Type of address. |
address__addresstypelower | STRING | Lowercase version of the address type. |
address__isvalidated | BOOLEAN | Indicates whether the address is validated. |
address__address2 | STRING | Second line of the address. |
address__address3 | STRING | Third line of the address. |
geo__location__type | STRING | Type of geographic location. |
supportsinventory | BOOLEAN | Indicates whether the location supports inventory. |
regularhours__sunday__label | STRING | Label for Sunday’s regular hours. |
regularhours__sunday__isclosed | BOOLEAN | Indicates whether the location is closed on Sunday. |
regularhours__sunday__opentime | STRING | Opening time for Sunday’s regular hours. |
regularhours__sunday__closetime | STRING | Closing time for Sunday’s regular hours. |
regularhours__monday__label | STRING | Label for Monday’s regular hours. |
regularhours__monday__isclosed | BOOLEAN | Indicates whether the location is closed on Monday. |
regularhours__monday__opentime | STRING | Opening time for Monday’s regular hours. |
regularhours__monday__closetime | STRING | Closing time for Monday’s regular hours. |
regularhours__tuesday__label | STRING | Label for Tuesday’s regular hours. |
regularhours__tuesday__isclosed | BOOLEAN | Indicates whether the location is closed on Tuesday. |
regularhours__tuesday__opentime | STRING | Opening time for Tuesday’s regular hours. |
regularhours__tuesday__closetime | STRING | Closing time for Tuesday’s regular hours. |
regularhours__wednesday__label | STRING | Label for Wednesday’s regular hours. |
regularhours__wednesday__isclosed | BOOLEAN | Indicates whether the location is closed on Wednesday. |
regularhours__wednesday__opentime | STRING | Opening time for Wednesday’s regular hours. |
regularhours__wednesday__closetime | STRING | Closing time for Wednesday’s regular hours. |
regularhours__thursday__label | STRING | Label for Thursday’s regular hours. |
regularhours__thursday__isclosed | BOOLEAN | Indicates whether the location is closed on Thursday. |
regularhours__thursday__opentime | STRING | Opening time for Thursday’s regular hours. |
regularhours__thursday__closetime | STRING | Closing time for Thursday’s regular hours. |
regularhours__friday__label | STRING | Label for Friday’s regular hours. |
regularhours__friday__isclosed | BOOLEAN | Indicates whether the location is closed on Friday. |
regularhours__friday__opentime | STRING | Opening time for Friday’s regular hours. |
regularhours__friday__closetime | STRING | Closing time for Friday’s regular hours. |
regularhours__saturday__label | STRING | Label for Saturday’s regular hours. |
regularhours__saturday__isclosed | BOOLEAN | Indicates whether the location is closed on Saturday. |
regularhours__saturday__opentime | STRING | Opening time for Saturday’s regular hours. |
regularhours__saturday__closetime | STRING | Closing time for Saturday’s regular hours. |
regularhours__timezone | STRING | Timezone for the regular hours. |
shippingorigincontact__firstname | STRING | First name of the shipping origin contact person. |
shippingorigincontact__lastnameorsurname | STRING | Last name or surname of the shipping origin contact person. |
shippingorigincontact__companyororganization | STRING | Company or organization of the shipping origin contact. |
shippingorigincontact__phonenumber | STRING | Phone number of the shipping origin contact person. |
shippingorigincontact__email | STRING | Email address of the shipping origin contact person. |
shippingorigincontact__middlenameorinitial | STRING | Middle name or initial of the shipping origin contact person. |
auditinfo__updatedate | TIMESTAMP | Timestamp indicating when the record was last updated. |
auditinfo__createdate | TIMESTAMP | Timestamp indicating when the record was created. |
auditinfo__updateby | STRING | User who last updated the record. |
auditinfo__createby | STRING | User who created the record. |
allowfulfillmentwithnostock | BOOLEAN | Indicates whether fulfillment is allowed without stock. |
isdisabled | BOOLEAN | Indicates whether the location is disabled. |
description | STRING | Description of the location. |
phone | STRING | Phone number of the location. |
fax | STRING | Fax number of the location. |
note | STRING | Note about the location. |
express | BOOLEAN | Indicates whether express service is available. |
transferenabled | BOOLEAN | Indicates whether transfers are enabled. |
includeininventoryaggregrate | BOOLEAN | Indicates whether to include the location in inventory aggregation. |
includeinlocationexport | BOOLEAN | Indicates whether to include the location in location export. |
warehouseenabled | BOOLEAN | Indicates whether the location is a warehouse. |
requiresmanifest | BOOLEAN | Indicates whether a manifest is required. |
shiptohomeconsolidation | BOOLEAN | Indicates whether ship-to-home consolidation is enabled. |
_id | STRING | Unique identifier for the location. |
_sdc_updatedate_block | TIMESTAMP | Timestamp indicating the update date block. |
_sdc_received_at | TIMESTAMP | Timestamp indicating when the data was received. |
_sdc_extracted_at | TIMESTAMP | Timestamp indicating when the data was extracted. |
_sdc_deleted_at | TIMESTAMP | Timestamp indicating when the record was deleted. |
_sdc_batched_at | TIMESTAMP | Timestamp indicating when the data was batched. |
_sdc_table_version | INTEGER | Version of the table. |
_sdc_sequence | INTEGER | Sequence number for the record. |
locations_locationtypecodes
Field Name | Type | Description |
value | STRING | String representing the location type code value. |
_sdc_source_key__id | STRING | String representing the source key ID. |
_sdc_source_updatedate_block | TIMESTAMP | Timestamp representing the block update date from the source. |
_sdc_source_updatedate | TIMESTAMP | Timestamp representing the update date from the source. |
_sdc_source_tenant | INTEGER | Integer representing the source tenant. |
_sdc_level_0_id | INTEGER | Integer representing the level 0 ID. |
_sdc_received_at | TIMESTAMP | Timestamp indicating when the data was received. |
_sdc_extracted_at | TIMESTAMP | Timestamp indicating when the data was extracted. |
_sdc_deleted_at | TIMESTAMP | Timestamp indicating when the data was marked as deleted. |
_sdc_batched_at | TIMESTAMP | Timestamp indicating when the data was batched. |
_sdc_table_version | INTEGER | Integer representing the table version. |
_sdc_sequence | INTEGER | Integer representing the sequence number. |
locations_fulfillmenttypecodes
Field Name | Type | Description |
value | STRING | String representing the fulfillment type code value. |
_sdc_source_key__id | STRING | String identifier from the source system. |
_sdc_source_updatedate_block | TIMESTAMP | Timestamp block of the source update. |
_sdc_source_updatedate | TIMESTAMP | Timestamp of the last update in the source system. |
_sdc_source_tenant | INTEGER | Integer representing the source tenant. |
_sdc_level_0_id | INTEGER | Integer identifier at level 0. |
_sdc_received_at | TIMESTAMP | Timestamp when the record was received. |
_sdc_extracted_at | TIMESTAMP | Timestamp when the record was extracted. |
_sdc_deleted_at | TIMESTAMP | Timestamp indicating when the record was marked as deleted. |
_sdc_batched_at | TIMESTAMP | Timestamp when the record was batched. |
_sdc_table_version | INTEGER | Integer indicating the table version. |
_sdc_sequence | INTEGER | Integer representing the sequence number. |
locations_attributes
Field Name | Type | Description |
fullyqualifiedname | STRING | String representing the fully qualified name of the attribute. |
attributedefinitionid | INTEGER | Integer identifier for the attribute definition. |
datatype | INTEGER | Integer representing the data type of the attribute. |
_sdc_source_key__id | STRING | String representing the source key identifier. |
_sdc_source_updatedate_block | TIMESTAMP | Timestamp representing the block of the source update date. |
_sdc_source_updatedate | TIMESTAMP | Timestamp representing the source update date. |
_sdc_source_tenant | INTEGER | Integer identifier for the source tenant. |
_sdc_level_0_id | INTEGER | Integer identifier for level 0. |
_sdc_received_at | TIMESTAMP | Timestamp representing when the data was received. |
_sdc_extracted_at | TIMESTAMP | Timestamp representing when the data was extracted. |
_sdc_deleted_at | TIMESTAMP | Timestamp representing when the data was marked as deleted. |
_sdc_batched_at | TIMESTAMP | Timestamp representing when the data was batched. |
_sdc_table_version | INTEGER | Integer representing the version of the table. |
_sdc_sequence | INTEGER | Integer representing the sequence of the data. |
locations_attributes_values
Field Name | Type | Description |
numbervalue | FLOAT | Numerical value of an attribute. |
boolvalue | BOOLEAN | Boolean value of an attribute. |
stringvalue | STRING | String value of an attribute. |
stringvaluelower | STRING | Lowercase string value of an attribute. |
datetimevalue | TIMESTAMP | Datetime value of an attribute. |
_sdc_source_key__id | STRING | Source system identifier for a key. |
_sdc_source_updatedate_block | TIMESTAMP | Timestamp indicating the block of the source update. |
_sdc_source_updatedate | TIMESTAMP | Timestamp indicating when the source data was last updated. |
_sdc_source_tenant | INTEGER | Identifier for the source tenant. |
_sdc_level_0_id | INTEGER | Internal identifier at level 0. |
_sdc_level_1_id | INTEGER | Internal identifier at level 1. |
_sdc_received_at | TIMESTAMP | Timestamp indicating when the data was received. |
_sdc_extracted_at | TIMESTAMP | Timestamp indicating when the data was extracted. |
_sdc_deleted_at | TIMESTAMP | Timestamp indicating when the data was marked as deleted. |
_sdc_batched_at | TIMESTAMP | Timestamp indicating when the data was batched. |
_sdc_table_version | INTEGER | Version number of the table. |
_sdc_sequence | INTEGER | Sequence number for data processing. |
locationgroups
Field Name | Type | Description |
tenantid | INTEGER | Unique identifier for the tenant. |
locationgroupid | INTEGER | Unique identifier for the location group. |
locationgroupcode | STRING | Code identifying the location group. |
locationgroupcodelower | STRING | Lowercase version of the location group code. |
name | STRING | Name of the location group. |
auditinfo__updatedate | TIMESTAMP | Timestamp indicating when the record was last updated. |
auditinfo__createdate | TIMESTAMP | Timestamp indicating when the record was created. |
auditinfo__updateby | STRING | User who last updated the record. |
auditinfo__createby | STRING | User who created the record. |
_id | STRING | Unique identifier for each record. |
_sdc_updatedate_block | TIMESTAMP | Timestamp indicating when the data was last updated. |
_sdc_received_at | TIMESTAMP | Timestamp indicating when the data was received. |
_sdc_extracted_at | TIMESTAMP | Timestamp indicating when the data was extracted. |
_sdc_deleted_at | TIMESTAMP | Timestamp indicating when the record was marked as deleted. |
_sdc_batched_at | TIMESTAMP | Timestamp indicating when the data was batched. |
_sdc_table_version | INTEGER | Version of the table schema. |
_sdc_sequence | INTEGER | Sequence number for the record. |
locationgroups_siteids
Field Name | Type | Description |
value | INTEGER | Integer representing a value associated with the location group and site ID relationship. |
_sdc_source_key__id | STRING | String representing the source system’s unique identifier. |
_sdc_source_updatedate_block | TIMESTAMP | Timestamp representing the block of updates in the source system. |
_sdc_source_updatedate | TIMESTAMP | Timestamp representing the last update date in the source system. |
_sdc_source_tenant | INTEGER | Integer representing the source tenant identifier. |
_sdc_level_0_id | INTEGER | Integer representing the level 0 identifier. |
_sdc_received_at | TIMESTAMP | Timestamp indicating when the data was received. |
_sdc_extracted_at | TIMESTAMP | Timestamp indicating when the data was extracted. |
_sdc_deleted_at | TIMESTAMP | Timestamp indicating when the data was marked as deleted. |
_sdc_batched_at | TIMESTAMP | Timestamp indicating when the data was batched. |
_sdc_table_version | INTEGER | Integer representing the version of the table. |
_sdc_sequence | INTEGER | Integer representing the sequence number of the record. |
inventory
Field Name | Type | Description |
product_id | INTEGER | Integer representing the unique identifier for a product. |
pending | INTEGER | Integer representing the quantity of a product that is pending. |
available | INTEGER | Integer representing the quantity of a product that is available for sale or use. |
updated | TIMESTAMP | Timestamp indicating when the inventory information was last updated. |
attributes | INTEGER | Integer representing attributes associated with the inventory. |
location_id | INTEGER | Integer representing the unique identifier for a location. |
allocated | INTEGER | Integer representing the quantity of a product that is allocated. |
onhand | INTEGER | Integer representing the total quantity of a product in stock. |
inventory_id | INTEGER | Integer representing the unique identifier for an inventory record. |
bin_id | INTEGER | Integer representing the identifier for the storage bin location. |
_sdc_batched_at | TIMESTAMP | Timestamp indicating when the data was batched. |
_sdc_received_at | TIMESTAMP | Timestamp indicating when the data was received. |
_sdc_extracted_at | TIMESTAMP | Timestamp indicating when the data was extracted. |
_sdc_deleted_at | TIMESTAMP | Timestamp indicating when the record was marked as deleted. |
_sdc_table_version | INTEGER | Integer representing the version of the table. |
_sdc_sequence | INTEGER | Integer representing the sequence number of the record. |
inventory_location
Field Name | Type | Description |
country_code | STRING | String representing the country code of the location. |
wms_enabled | BOOLEAN | Boolean value indicating whether the location is enabled with a warehouse management system. |
location_name | STRING | String representing the name of the location. |
pickup | BOOLEAN | Boolean value indicating whether in-store pickup is available at the location. |
updated | TIMESTAMP | Timestamp indicating when the record was last updated. |
transfer_enabled | BOOLEAN | Boolean value indicating whether transfers are enabled at the location. |
sth_processing_time_hours | INTEGER | Integer representing the processing time in hours for Ship to Home orders. |
latitude | FLOAT | Float representing the latitude coordinate of the location. |
transfer_time_processing_hours | INTEGER | Integer representing the processing time in hours for transfers. |
receive_processing_time_hours | INTEGER | Integer representing the processing time in hours for receiving goods. |
location_code | STRING | String representing the unique code for the location. |
bopis_processing_time_hours | INTEGER | Integer representing the processing time in hours for Buy Online Pickup In Store orders. |
direct_ship | BOOLEAN | Boolean value indicating whether direct shipping is available at the location. |
tenant_id | INTEGER | Integer representing the unique identifier for the tenant. |
include_in_location_export | BOOLEAN | Boolean value indicating whether the location should be included in location exports. |
include_in_aggregate | BOOLEAN | Boolean value indicating whether the location should be included in aggregate calculations. |
longitude | FLOAT | Float representing the longitude coordinate of the location. |
express | BOOLEAN | Boolean value indicating whether express services are available at the location. |
location_id | INTEGER | Integer representing the unique identifier for the location. |
postal_code | STRING | String representing the postal code of the location. |
active | BOOLEAN | Boolean value indicating whether the location is currently active. |
created | TIMESTAMP | Timestamp indicating when the record was created. |
_sdc_batched_at | TIMESTAMP | Timestamp indicating when the record was batched. |
_sdc_received_at | TIMESTAMP | Timestamp indicating when the record was received. |
_sdc_extracted_at | TIMESTAMP | Timestamp indicating when the record was extracted. |
_sdc_deleted_at | TIMESTAMP | Timestamp indicating when a record was marked as deleted. |
_sdc_table_version | INTEGER | Integer representing the version of the table. |
_sdc_sequence | INTEGER | Integer representing the sequence number of the record. |
inventory_product
Field Name | Type | Description |
block_assignment | BOOLEAN | Boolean value indicating if a product has a block assignment. |
product_id | INTEGER | Integer representing the unique identifier for a product. |
safety_stock | INTEGER | Integer representing the safety stock level for a product. |
updated | TIMESTAMP | Timestamp indicating when a record was last updated. |
floor | INTEGER | Integer representing the floor location of a product. |
location_id | INTEGER | Integer representing the unique identifier for a location. |
upc | STRING | String representing the universal product code for a product. |
part_number | STRING | String representing the part number of a product. |
sku | STRING | String representing the stock keeping unit for a product. |
ltd | INTEGER | Integer representing a limited quantity or threshold. |
_sdc_batched_at | TIMESTAMP | Timestamp indicating when a record was batched for processing. |
_sdc_received_at | TIMESTAMP | Timestamp indicating when a record was received. |
_sdc_extracted_at | TIMESTAMP | Timestamp indicating when a record was extracted. |
_sdc_deleted_at | TIMESTAMP | Timestamp indicating when a record was marked as deleted. |
_sdc_table_version | INTEGER | Integer representing the version of the table schema. |
_sdc_sequence | INTEGER | Integer representing the sequence of changes to a record. |
shipment_items_options
Field Name | Type | Description |
name | STRING | Name of the option. |
stringvalue | STRING | String representation of the value. |
value | STRING | String representation of the option value. |
attributefqn | STRING | Fully qualified name of the attribute. |
datatype | STRING | Data type of the option’s value. |
value__string | STRING | String representation of the option’s value. |
value__boolean | BOOLEAN | Boolean value of the option. |
value__inst | TIMESTAMP | Timestamp value of the option. |
value__double | FLOAT | Floating-point value of the option. |
value__bigint | INTEGER | Integer value of the option. |
shopperenteredvalue | STRING | String value entered by the shopper. |
shopperenteredvalue__string | STRING | String value entered by the shopper for the option. |
shopperenteredvalue__boolean | BOOLEAN | Boolean value entered by the shopper for the option. |
shopperenteredvalue__inst | TIMESTAMP | Timestamp value entered by the shopper for the option. |
shopperenteredvalue__double | FLOAT | Floating-point value entered by the shopper for the option. |
shopperenteredvalue__bigint | INTEGER | Integer value entered by the shopper for the option. |
_sdc_source_key__id | STRING | Source key identifier. |
_sdc_source_updatedate_block | TIMESTAMP | Timestamp representing the block when the source data was updated. |
_sdc_source_updatedate | TIMESTAMP | Timestamp representing when the source data was updated. |
_sdc_source_tenant | INTEGER | Identifier for the source tenant. |
_sdc_level_0_id | INTEGER | Level 0 identifier. |
_sdc_level_1_id | INTEGER | Level 1 identifier. |
_sdc_received_at | TIMESTAMP | Timestamp indicating when the data was received. |
_sdc_batched_at | TIMESTAMP | Timestamp indicating when the data was batched. |
_sdc_deleted_at | TIMESTAMP | Timestamp indicating when the data was marked as deleted. |
_sdc_extracted_at | TIMESTAMP | Timestamp indicating when the data was extracted. |
_sdc_table_version | INTEGER | Version number of the table. |
_sdc_sequence | INTEGER | Sequence number for tracking changes. |