
Watch: Storefront & Analytics Settings
Learn how to configure storefront and analytics tool settings
- Searching error logs
- Searching API Extension action logs
- Analyzing HTTP traffic metrics
Correlation ID Lookup
Error logs provide more detail about why an error occurred and can help you with troubleshooting. When a platform error occurs, the system logs it according to the unique identifier of the associated API request, known as a correlation ID. The correlation ID displays in either the Dev Center UI or API response body; depending on how you’re using the platform. You must search for error logs by correlation ID.- Log in to Dev Center.
- Go to Logs > Correlation ID Lookup.
- Enter a correlation ID associated with an error in the search text box at the top right.
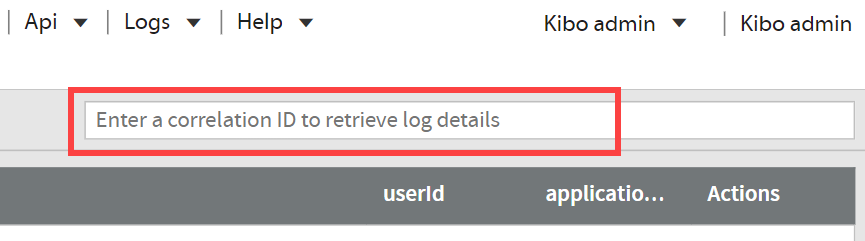
- Press enter.
- Double click an error log to see details.
API Extension Action Logs
Action logs contain details about custom JavaScript functions that have been developed using the API Extension framework and installed on a tenant. You can only view action logs for tenants to which you have access. Log details vary based on the log level, or severity, a custom function is configured to use (e.g., debug, info, warn, error, and fatal). Refer to Action Management JSON Editor for more information. Action logs can tell you:- When a custom function began executing.
- When a custom function finished executing.
- How much time it took a custom function to execute.
- When and why a custom function failed to execute successfully.
- Log in to Dev Center.
- Go to Logs > Action Logs.
- Click the Selected Tenant field and select a tenant from the drop-down menu that appears.
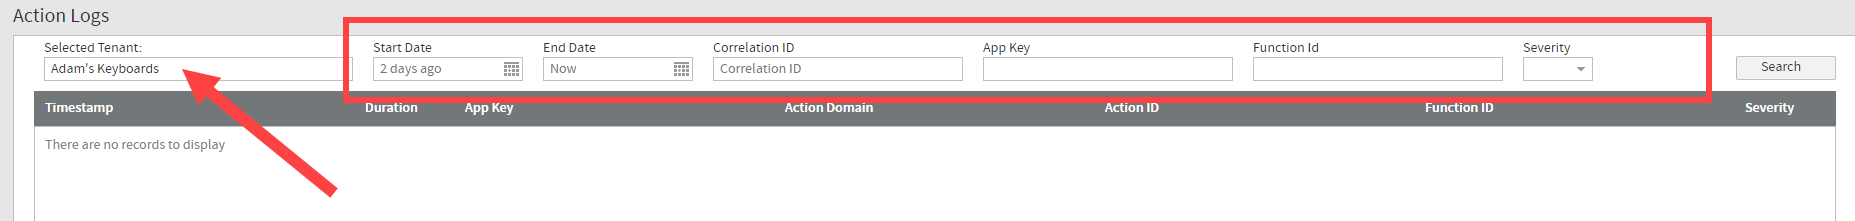
- (Optional) Apply one or more of the following filters to narrow the results.
- Start Date: The beginning date of the query.
- Correlation ID: The unique ID of the API request that an application used to perform an action.
- App Key: The unique ID of the application that performs an action.
- Function ID: The type of action that an application performs.
- Severity: The log level that actions use in an application.
- Click Search.
- Click a log to see details.
- If desired, click View Related Entries to search for additional logs related to a selected log.
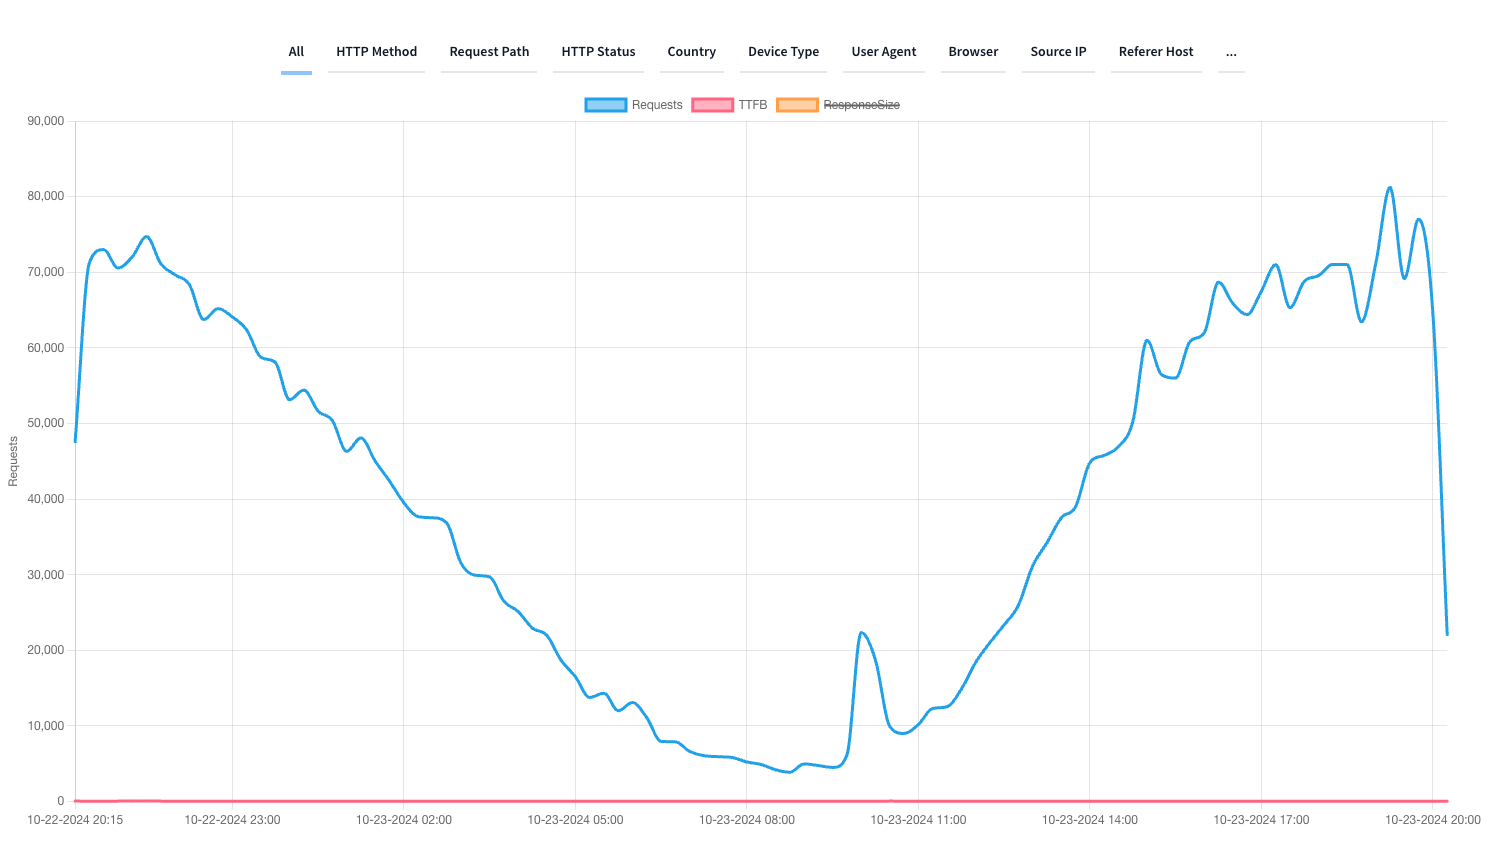
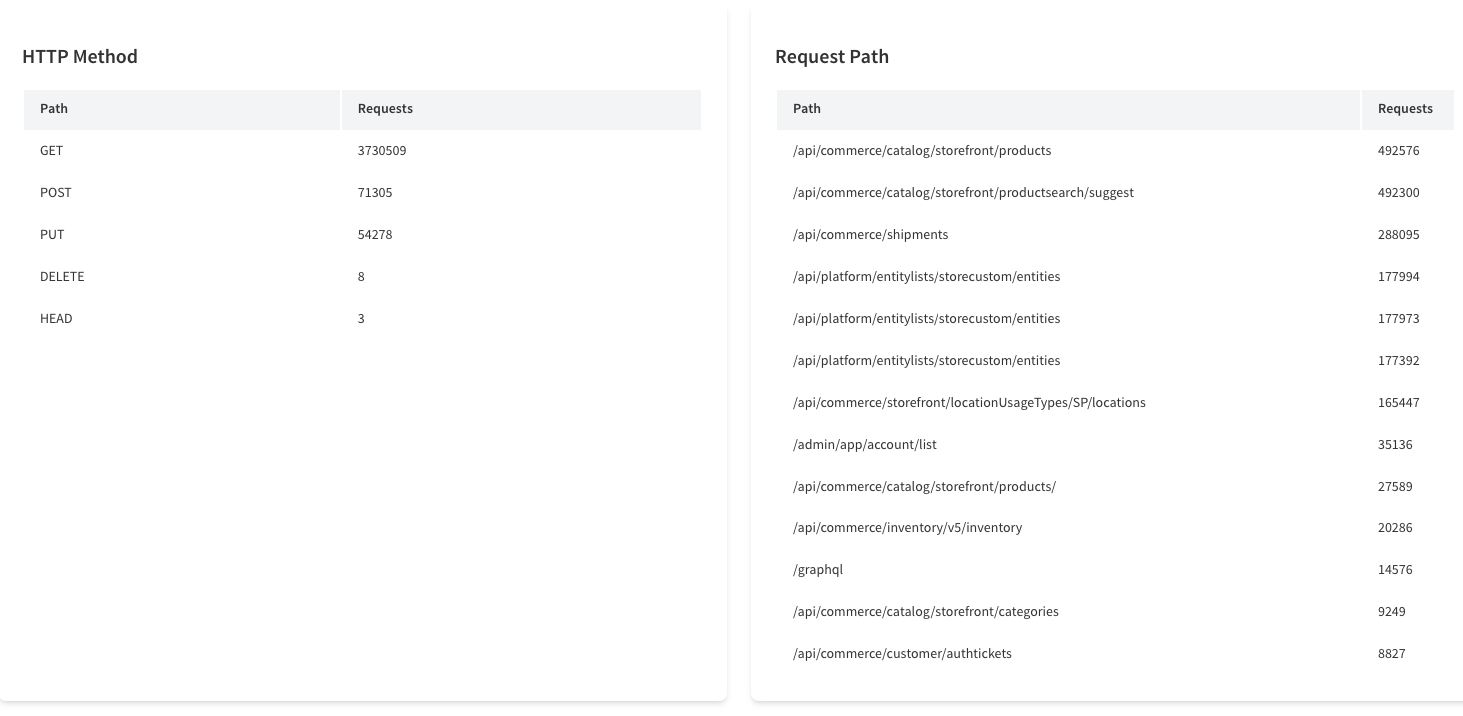
HTTP Traffic
HTTP traffic metrics are analytics that help you measure your site performance as experienced by visitors. Filters can refine the request data for more specific and custom criteria, while dimensions organize the data based on different categories and support filtering.- Log in to Dev Center.
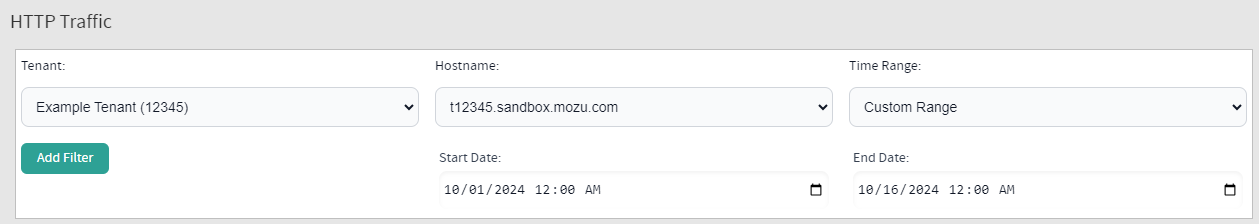
- Go to Logs > HTTP Traffic.
- Select a Tenant, Hostname, and Time Range from the drop-down menus. If you select Custom Range for the time range, then enter a Start Date and End Date as prompted.
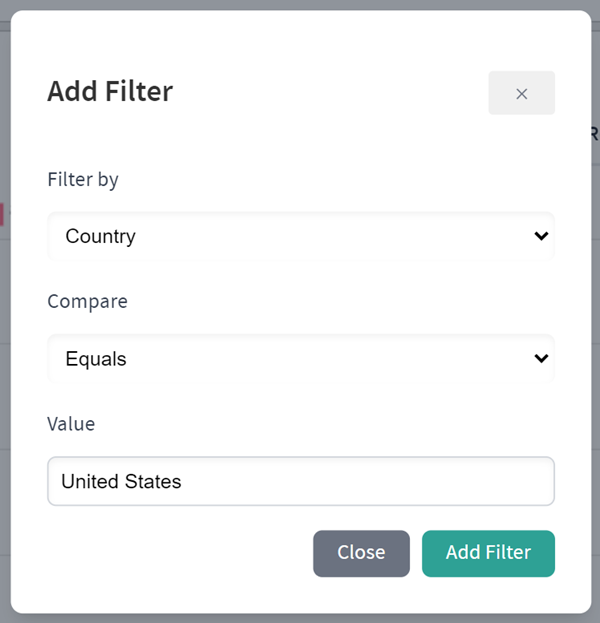
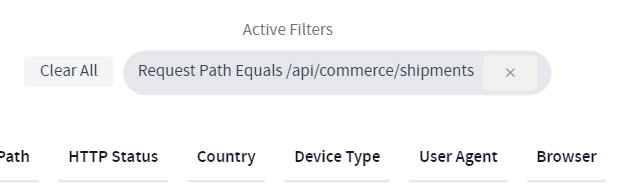
- (Optional) If you want to further specify your results, click Add Filter. In the pop-up that appears:
- Select a dimension to base the filter on.
- Select a comparison operator available for that data type.
- Enter a custom value that you want to compare visitor results to.
- Click Add Filter. Repeat Step #4 to create additional filters if desired.