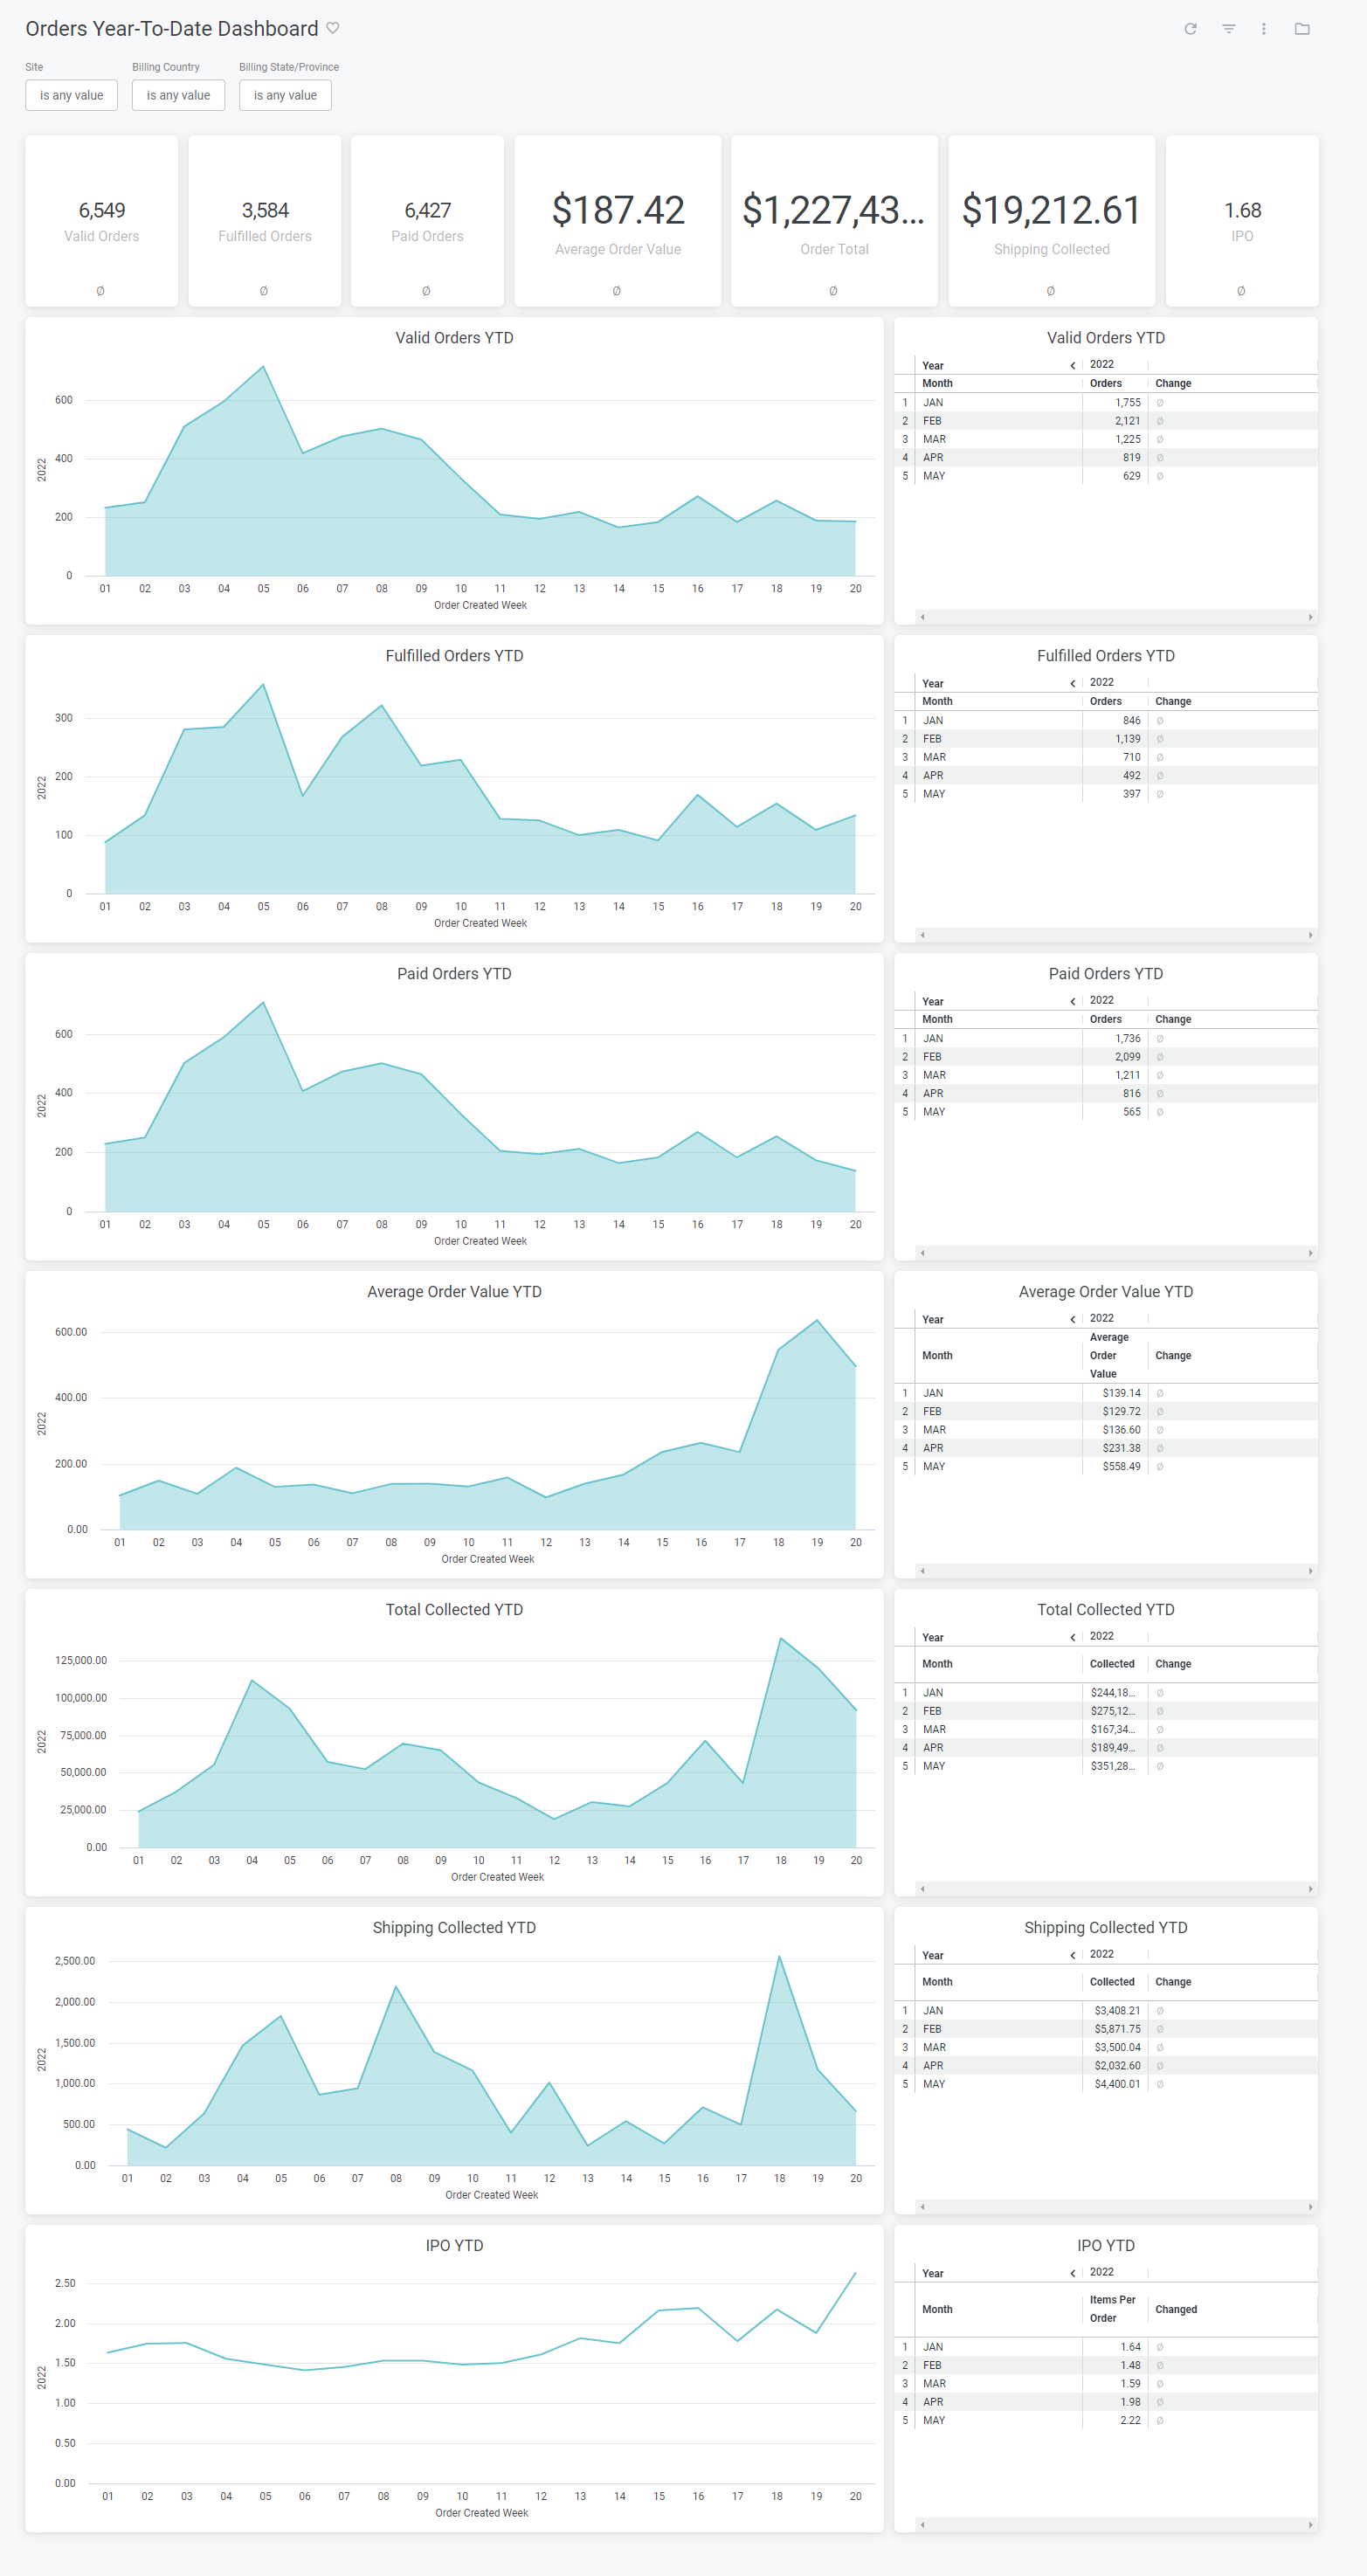
| Valid Orders | The valid orders count. Year-over-year uses the same calendar dates one year prior to display the change as a percentage rounded to the nearest whole number. |
| Fulfilled Orders | The fulfilled orders count. Year-over-year uses the same calendar dates one year prior to display the change as a percentage rounded to the nearest whole number. |
| Paid Orders | The paid orders count. Year-over-year uses the same calendar dates one year prior to display the change as a percentage rounded to the nearest whole number. |
| Average Order Value | The average order vallue. Year-over-year uses the same calendar dates one year prior to display the change as a percentage rounded to the nearest whole number. |
| Order Total | The order total. Year-over-year uses the same calendar dates one year prior to display the change as a percentage rounded to the nearest whole number. |
| Shipping Collected | The sum of the collecting shipping total for all valid orders. |
| Items Per Order | The items per order. Year-over-year uses the same calendar dates one year prior to display the change as a percentage rounded to the nearest whole number. |
| Valid Orders YTD (Area) | The valid orders count bucketed by week of the year. Year-over-year uses the same week number from the previous year. |
| Valid Orders YTD (Table) | The valid orders count bucketed by calendar month. Year-over-year uses the same calendar month from the previous year. |
| Fulfilled Orders YTD (Area) | The fulfilled orders count bucketed by week of the year. Year-over-year uses the same week number from the previous year. |
| Fulfilled Orders YTD (Table) | The fulfilled orders count bucketed by calendar month. Year-over-year uses the same calendar month from the previous year. |
| Paid Orders YTD (Area) | The paid orders count bucketed by week of the year. Year-over-year uses the same week number from the previous year. |
| Paid Orders YTD (Table) | The paid orders count bucketed by calendar month. Year-over-year uses the same calendar month from the previous year. |
| Average Order Value YTD (Area) | The average order value count bucketed by week of the year. Year-over-year uses the same week number from the previous year. |
| Average Order Value YTD (Table) | The average order value bucketed by calendar month. Year-over-year uses the same calendar month from the previous year. |
| Order Total YTD (Area) | The order total count bucketed by week of the year. Year-over-year uses the same week number from the previous year. |
| Order Total YTD (Table) | The order total count bucketed by calendar month. Year-over-year uses the same calendar month from the previous year. |
| Shipping Collected YTD (Area) | The shipping total bucketed by week of the year. Year-over-year uses the same week number from the previous year. |
| Shipping Collected YTD (Table) | The shipping total bucketed by calendar month. Year-over-year uses the same calendar month from the previous year. |
| Items Per Order YTD (Area) | The items per order bucketed by week of the year. Year-over-year uses the same week number from the previous year. |
| Items Per Order YTD (Table) | The items per order bucketed by calendar month. Year-over-year uses the same calendar month from the previous year. |