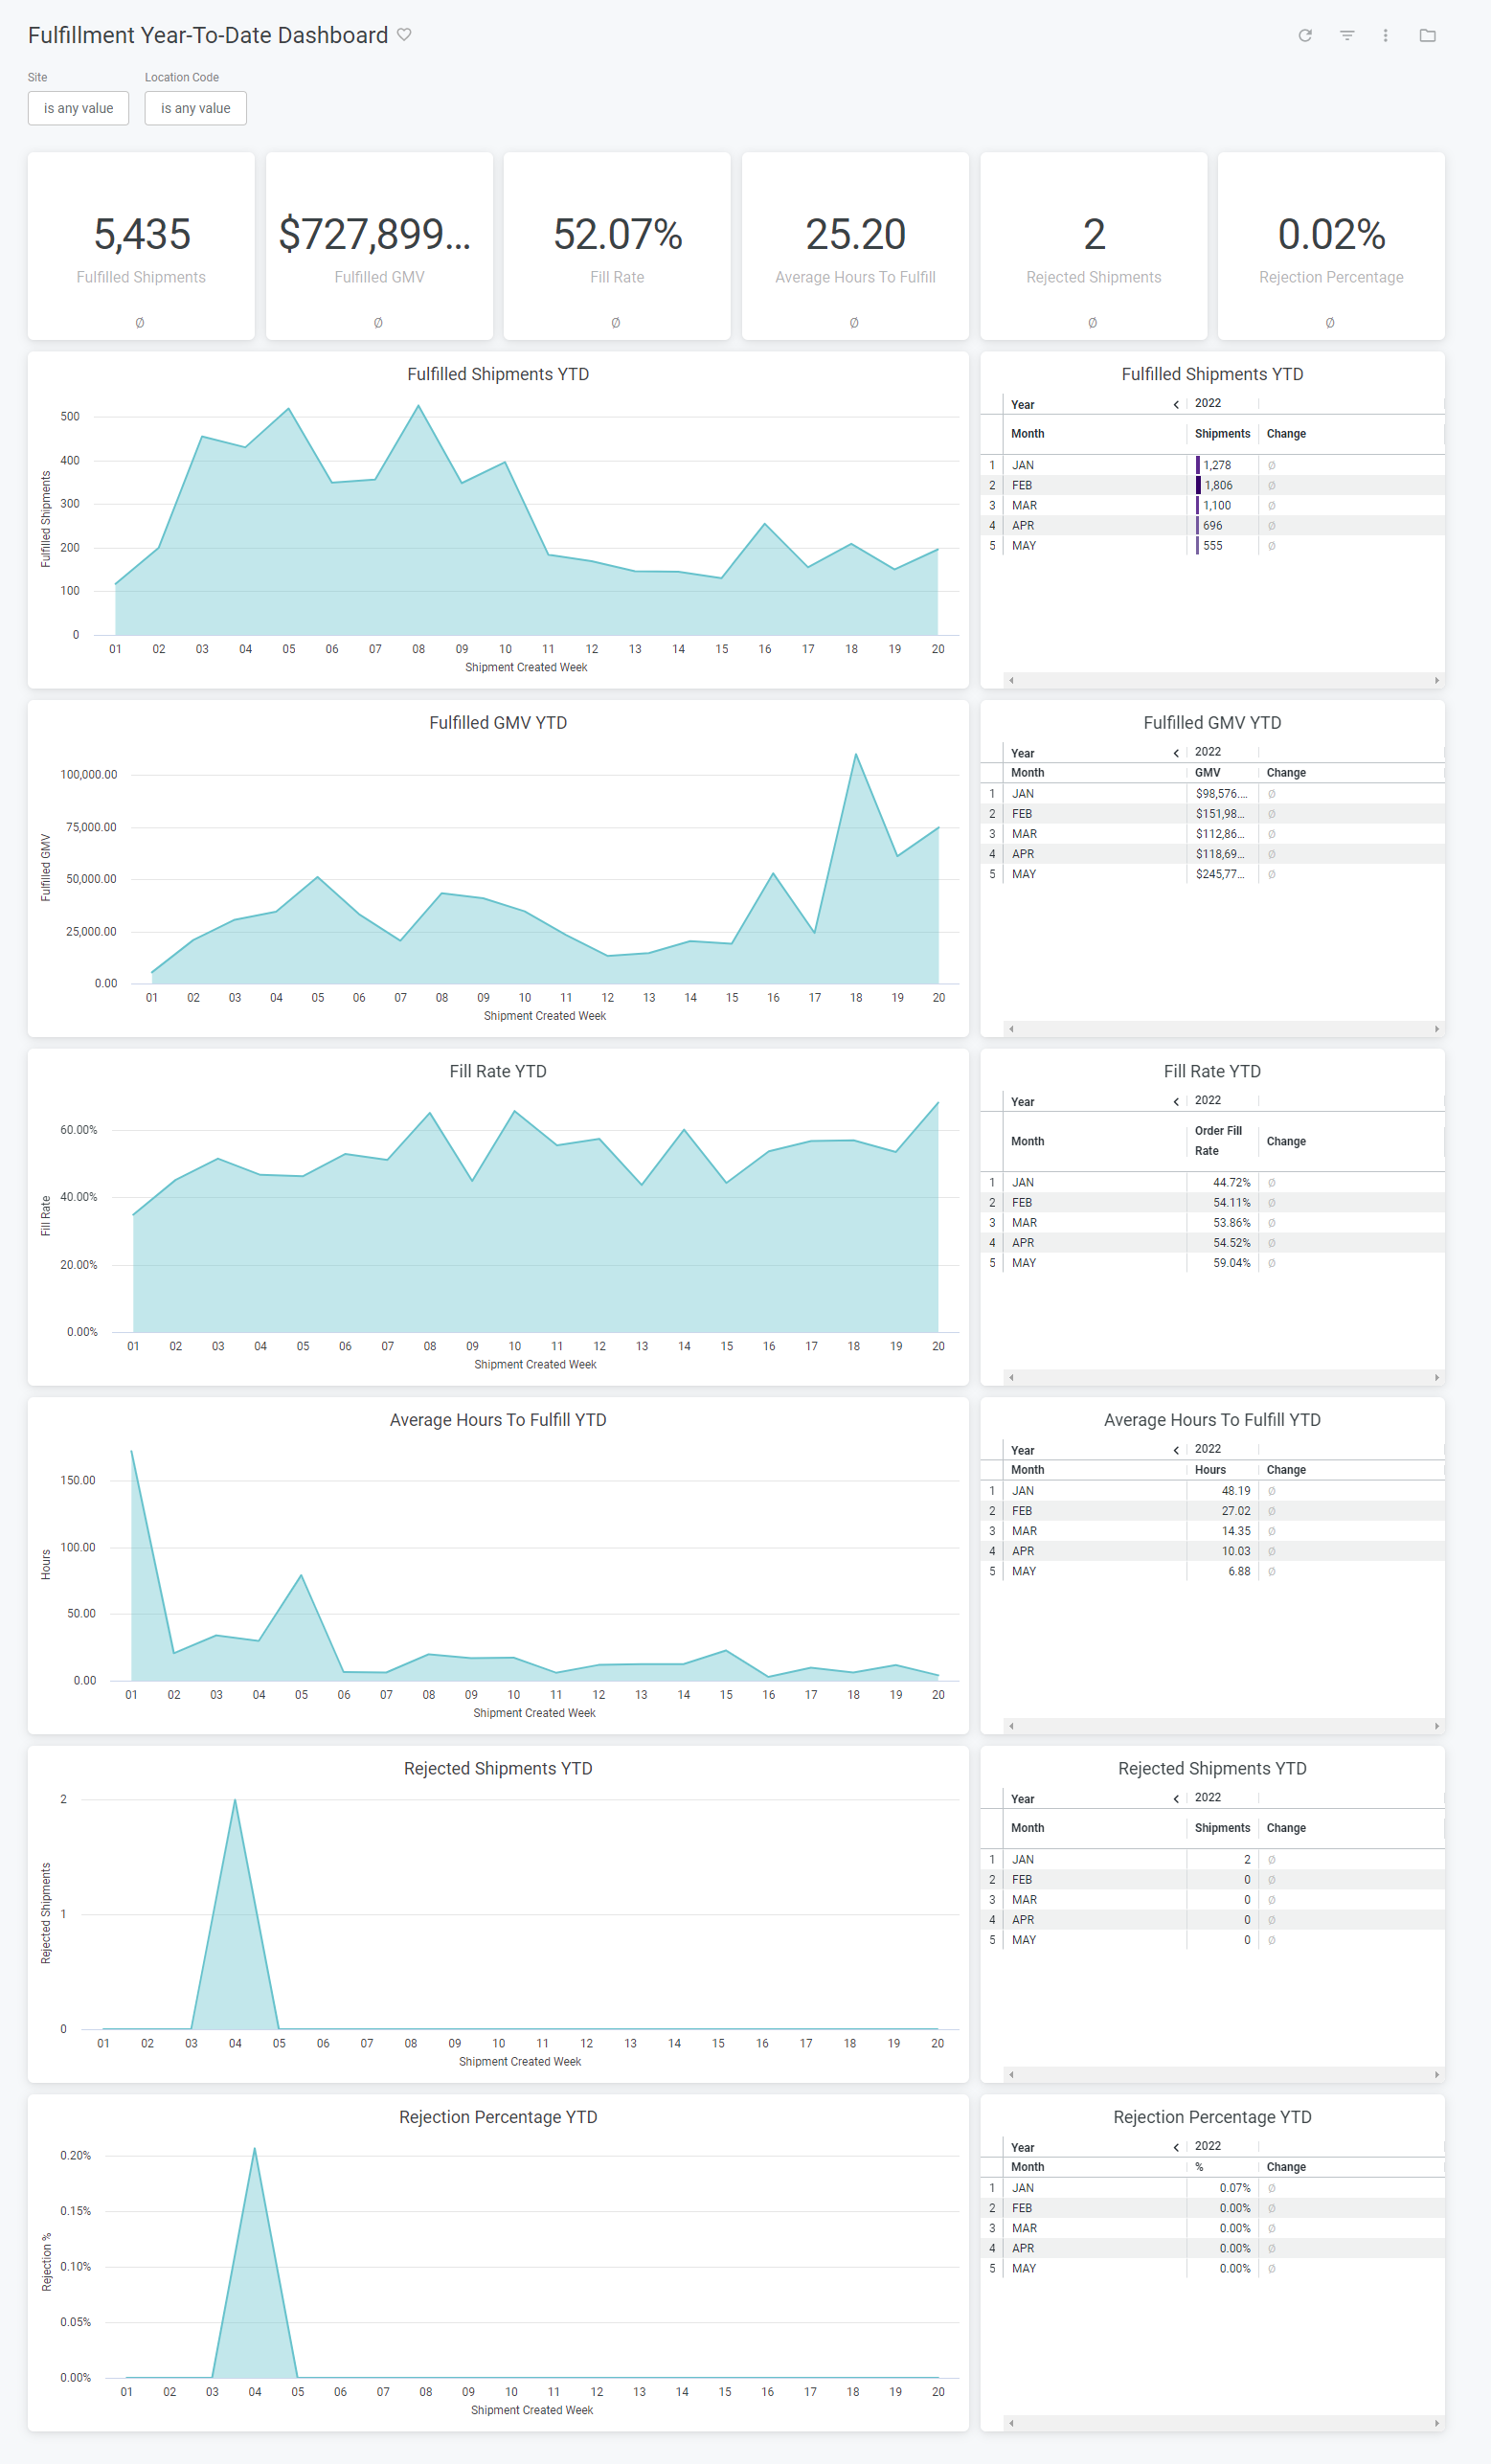
| Fulfilled GMV | The fulfilled GMV for all shipments. Year-over-year uses the same calendar dates one year prior. |
| Fulfilled Shipments | The fulfilled shipment count. Year-over-year uses the same calendar dates one year prior. |
| Fill Rate | The shipment fill rate. Year-over-year uses the same calendar dates one year prior. |
| Rejected Shipments | The rejected shipment count. Year-over-year uses the same calendar dates one year prior. |
| Average Hours To Fulfill | The average hours to fulfill all shipments. Year-over-year uses the same calendar dates one year prior. |
| Rejection Percentage | The rejection percentage for all shipments. Year-over-year uses the same calendar dates one year prior. |
| Fulfilled GMV YTD (Area) | The fulfilled GMV bucketed by week of the year. Year-over-year uses the same week number from the previous year. |
| Fulfilled GMV YTD (Table) | The fulfilled GMV bucketed by calendar month. Year-over-year uses the same calendar month from the previous year. |
| Fulfilled Shipments YTD (Area) | The fulfilled shipment count bucketed by week of the year. Year-over-year uses the same week number from the previous year. |
| Fulfilled Shipments YTD (Table) | The fulfilled shipment count bucketed by calendar month. Year-over-year uses the same calendar month from the previous year. |
| Fill Rate YTD (Area) | The order fill rate bucketed by week of the year. Year-over-year uses the same week number from the previous year. |
| Fill Rate YTD (Table) | The order fill rate bucketed by calendar month. Year-over-year uses the same calendar month from the previous year. |
| Rejected Shipments YTD (Area) | The rejected shipment count bucketed by week of the year. Year-over-year uses the same week number from the previous year. |
| Rejected Shipments YTD (Table) | The rejected shipment count bucketed by calendar month. Year-over-year uses the same calendar month from the previous year. |
| Average Hours To Fulfill YTD (Area) | The average hours to fulfill bucketed by week of the year. Year-over-year uses the same week number from the previous year. |
| Average Hours To Fulfill YTD (Table) | The average hours to fulfill bucketed by calendar month. Year-over-year uses the same calendar month from the previous year. |
| Rejection Percentage YTD (Area) | The rejection percentage bucketed by week of the year. Year-over-year uses the same week number from the previous year. |
| Rejection Percentage YTD (Table) | The rejection percentage bucketed by calendar month. Year-over-year uses the same calendar month from the previous year. |