

| Name | Description | Default |
|---|---|---|
| Site | Restrict results to one or more of your sites. | All |
| Order Item Created Date | Limit results to only order items created within this time range. | Past ten weeks |
| Product Code | The unique identifier for a product within your catalog. Note: This is a mandatory filter and a value must be supplied for the dashboard to render. | Empty |
| Name | Description |
|---|---|
| Order Item Total Collected | The sum of all order item totals net of taxes, shipping, and discounts; and where the order status is not abandoned or cancelled. |
| Total Quantity Sold | Sum of the quantity for each order item where the associated order is not in abandoned or cancelled status. |
| Average Item Price | The catalog price minus discounts average for total quantity sold. |
| Name | Description |
|---|---|
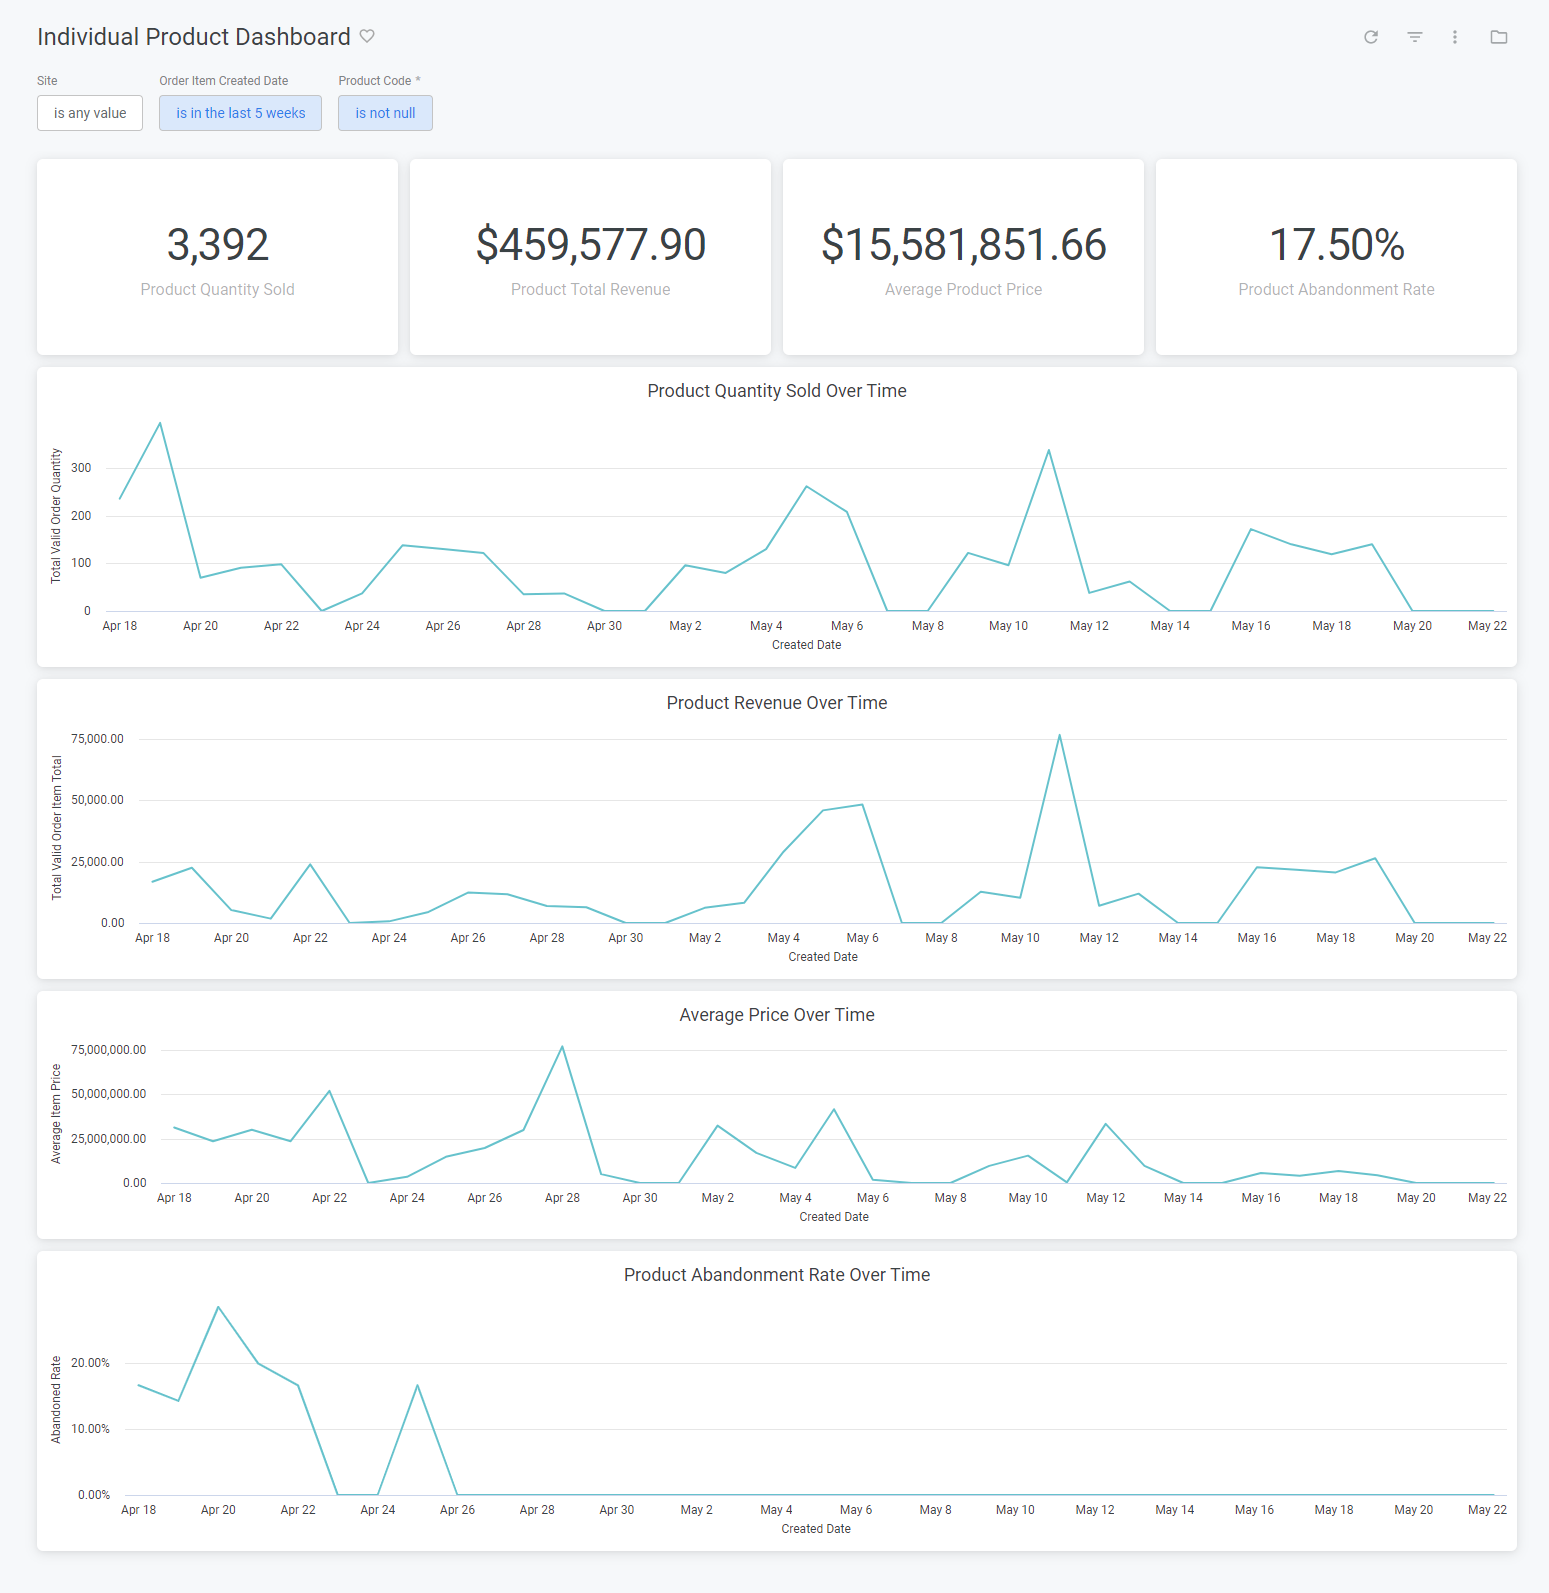
| Product Quantity Sold | The total quantity sold. |
| Product Total Revenue | The order item total collected. |
| Average Product Price | The average item price. |
| Product Abandonment Rate | The percentage of abandoned products. |
| Product Quantity Sold Over Time | The total quantity sold bucketed by calendar date. |
| Product Revenue Over Time | The order item total collected bucketed by calendar date. |
| Average Price Over Time | The average item price bucketed by calendar date. |
| Product Abandonment Rate Over Time | The product abandonment rate bucketed by calendar date. |