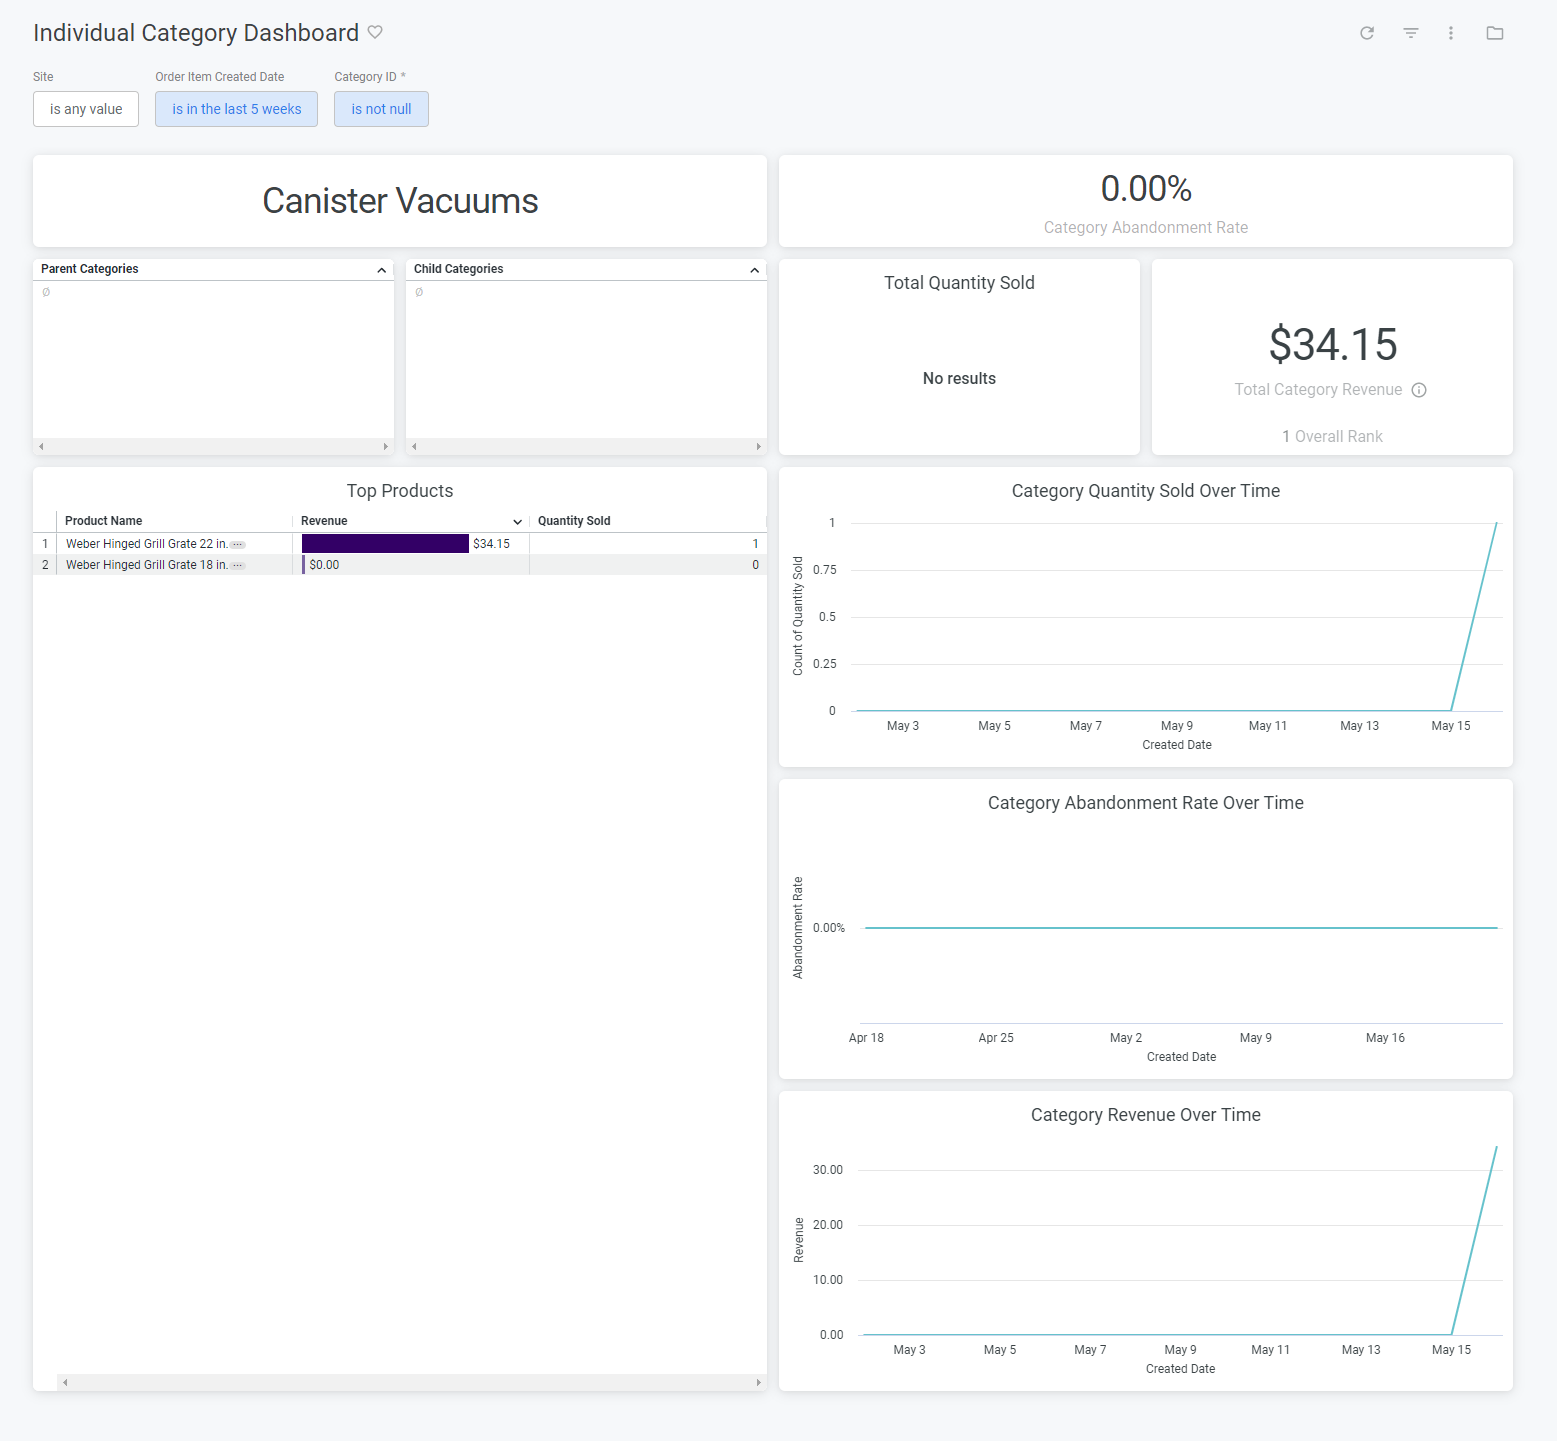
The Individual Category dashboard keeps you up to date on how product categories are performing. It can be viewed from Kibo Standard Reports > Product > Individual Category Dashboard.The supported filters that can be applied to this dashboard are:
Name
Description
Default
Site
Restrict results to one or more of your sites.
All
Order Item Created Date
Limit results to only order items created within this time range.
Past ten weeks
Category ID
Specifies the category on which to report.
Empty
The measures that are calculated by this dashboard are:
Name
Description
Abandonment Rate
The percentage of carts created that expire before placing an order.
Total Quantity Sold
Sum of the quantity for each order item where the associated order is not in abandoned or cancelled status.
Total Revenue
The sum of order total for all orders.
The tiles that make up this dashboard are:
Name
Description
Category Abandonment Rate
The abandonment rate for the entire product category.
Category Quantity Sold Over Time
Line graph showing the daily quantity sold.
Category Abandonment Rate Over Time
Line graph showing the abandonment rate for the category for each day.
Category Revenue Over Time
Line graph showing the total revenue for the category for each day.
Child Categories
A list of the child categories for this category. Clicking the name will link to the individual category dashboard for the child category.
Parent Categories
A list of the parent categories for this category. Clicking the name will link to the individual category dashboard for the parent category.
Top Products
A list of the products with the highest total revenue within that category. Quantity sold is also displayed for each product.
Total Quantity Sold
The quantity sold for the entire product category.
Total Category Revenue
The total revenue for the entire product category.