

Analyze with Kibo AI
Analyze capabilities answer business questions with charts and numbers directly in the chat. They are read-only.Analytics
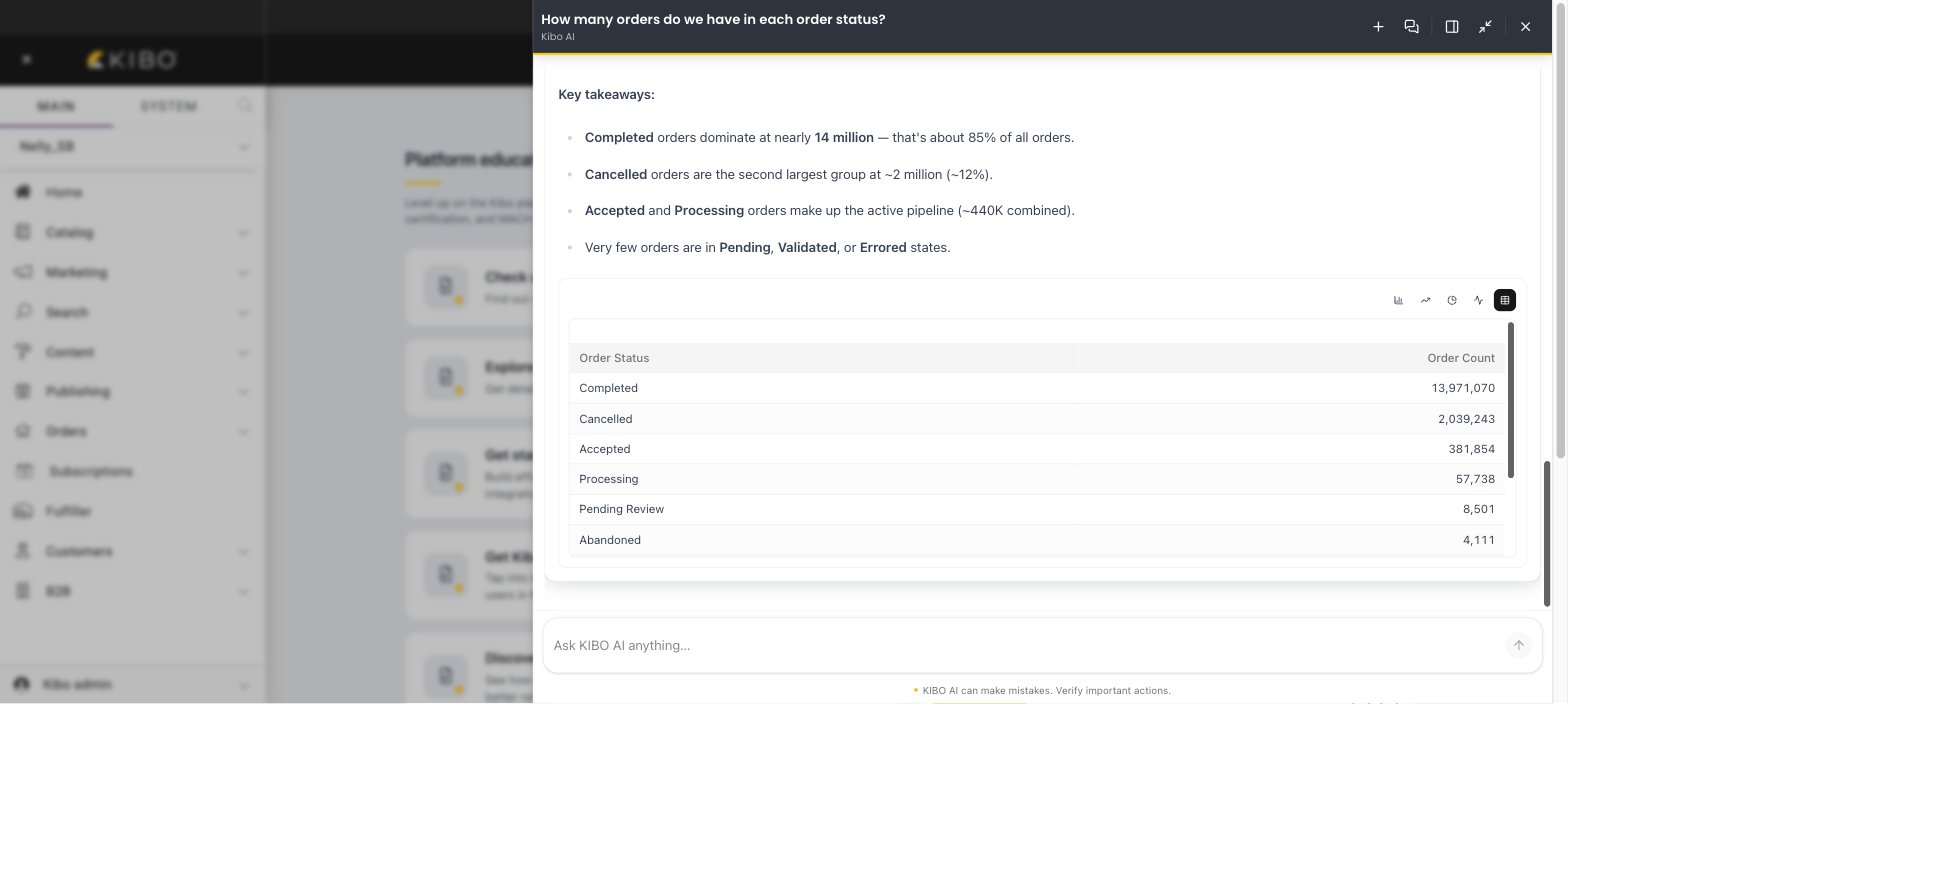
Ask business questions about orders, revenue, fulfillment, products, discounts, and customers. You can ask Kibo AI to:- Report on orders, average order value, and revenue over time, including by geography.
- Report on fulfillment performance, including fill rates and rejection rates.
- Report on product performance and top sellers.
- Analyze discount redemptions and impact.
- Report on customer data.
- Present results as a summary, a table, or an inline chart (line, area, pie, or bar), and interpret relative time periods such as “last 30 days.”
Note: Analytics is read-only. It does not create saved reports, schedule recurring queries, or export beyond what the chat provides.
- “Show me our revenue over the last 6 months.”
- “What’s our average order value trend this year?”
- “What were our top 10 products by revenue in the last 30 days?”
- “How is our shipment fill rate trending month over month?”
- “Break down revenue by fulfillment type for the last 30 days.”
- “Which discounts drove the most redemptions last quarter?”
- “What was the total discount amount we gave away across all promotions last month?”
- “Show me 2026 revenue broken down by state.”