Reports are used to retrieve and visualize statistics about orders, based on different details and topics. Several reports are provided out-of-the-box, while additional custom reports can be designed as needed. All reports can be viewed within the Kibo Composable Commerce Platform (KCCP) or exported as a file for external use.
Reporting Definitions
Before getting into the different aspects of the Reporting UI, here are some definitions that should be understood in order to browse reports:
- A dashboard is a homepage where all reports about a particular topic are displayed.
- Filters can be applied to those reports to specify the data being collected.
- Dashboards consist of measures and tiles.
- A measure is an aggregated calculation. For example, an order has a tax total attribute that is the amount of tax charged to the customer. We could add a measure called Total Tax that is the sum of the tax total for all orders.
- The dashboard is laid out as a series of tiles, which are the individual reports within the dashboard topic. These tiles display measures as well as additional data that are not aggregated calculations.
- Explores are a collection of data focused on a particular topic. They can be used for creating custom reports or ad hoc data exploration.
- Explores consist of views, which in turn are made up of measures, dimensions, and occasionally filters.
- A view is a section of the explore that displays a group of related data. Views usually include an associated measure that indicates the total records for that element on the site, as well as a set of dimensions.
- Dimensions are data values for a single record (like one order), in contrast to a measure that calculates the value for a set of records (like all orders). Dimensions are often related to API parameters; for instance, the Customer Explore includes a view that details customer datapoints found in the Customer APIs.
User Permissions
Only one default user role has the permissions necessary to access Reporting, the Report Super User. To allow other users to view and/or edit reports, you must either give them that role or add the appropriate behaviors to another role and assign it to them.
The two behaviors used for reporting access are:
- Report Read: Allows the user to view all reports and download them.
- Report Definition Update: Allows the user to edit existing report definitions, which includes creating and saving personal reports (visible to them), group reports (visible to other editors), and custom reports.
View Reports
There are report categories, or "dashboards," that are provided out-of-the-box as Kibo Standard Reports. Custom reports are detailed in their own section of this guide.
- Go to Main > Reports. The landing page will display the Order Dashboard with default filter options (specifically, displaying orders from all sites from the current month).
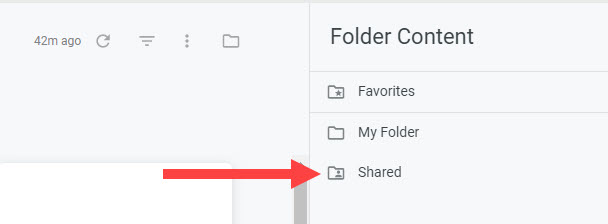
- Click the folder icon in the top right. A navigation menu of the folder directory appears.
- Click Shared. Favorites and My Folder are personal folders that are empty by default.
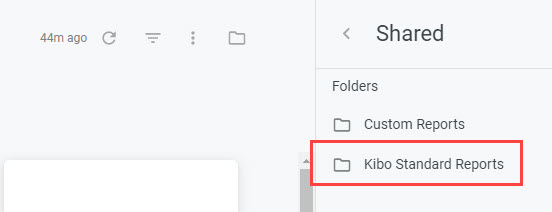
- Click Kibo Standard Reports.
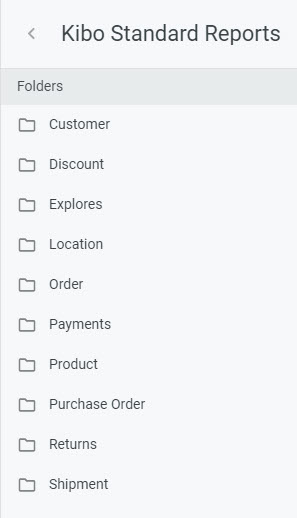
- A list of all report topics is displayed. Select a topic.
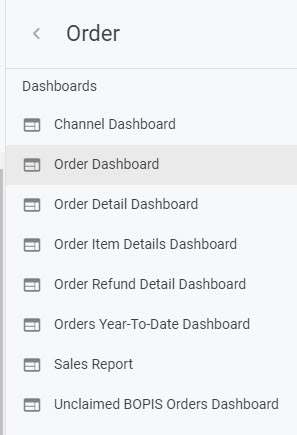
- All of the dashboards within that report topic is displayed. Click any dashboard to view that specific report.


Dashboards
A dashboard is a homepage where all reports about a particular topic are displayed. There are numerous dashboards for different topics in KCCP covering locations, discounts, shipments, products, orders, payments, purchase orders, returns, and more.

Dashboards consist of measures and tiles. A measure is an aggregated calculation. For example, an order has a tax total attribute that is the amount of tax charged to the customer. We could add a measure called Total Tax that is the sum of the tax total for all orders.
The dashboard is laid out as a series of tiles, which are the individual reports within the dashboard topic. These tiles display measures as well as additional data that are not aggregated calculations.
For example, the Order Dashboard shown above includes tiles for Order Total (which is an aggregated measure) and Weekly Order Total (which is not a measure). The former is displayed as simply a number, while the latter is displayed as a chart.
Explores and Views
Explores are a collection of data focused on a particular topic. They can be used for creating custom reports or ad hoc data exploration and can be found at Kibo Standard Reports > Explores.
Each of these explores contains at least one view that displays data. Views usually include an associated measure that indicates the total records for that element on the site, as well as a set of dimensions.
Dimensions are data values for a single record (like one order), in contrast to a measure that calculates the value for a set of records (like all orders). Dimensions are often related to API parameters; for instance, the Customer Explore includes a view that details customer data points found in the Customer APIs.