

| Name | Description | Default |
|---|---|---|
| Site | Restrict results to one or more of your sites. | All |
| Return Created Date | Limit results to only returns created within this time range. | Past three complete months |
| Location Code | Limit results to a specific location. | All |
| Name | Description |
|---|---|
| Return Count | The count of all returns. |
| Return Loss Total | The sum of the product loss for all returns. |
| Return Percentage | The count of returns divided by the count of orders. |
| Name | Description |
|---|---|
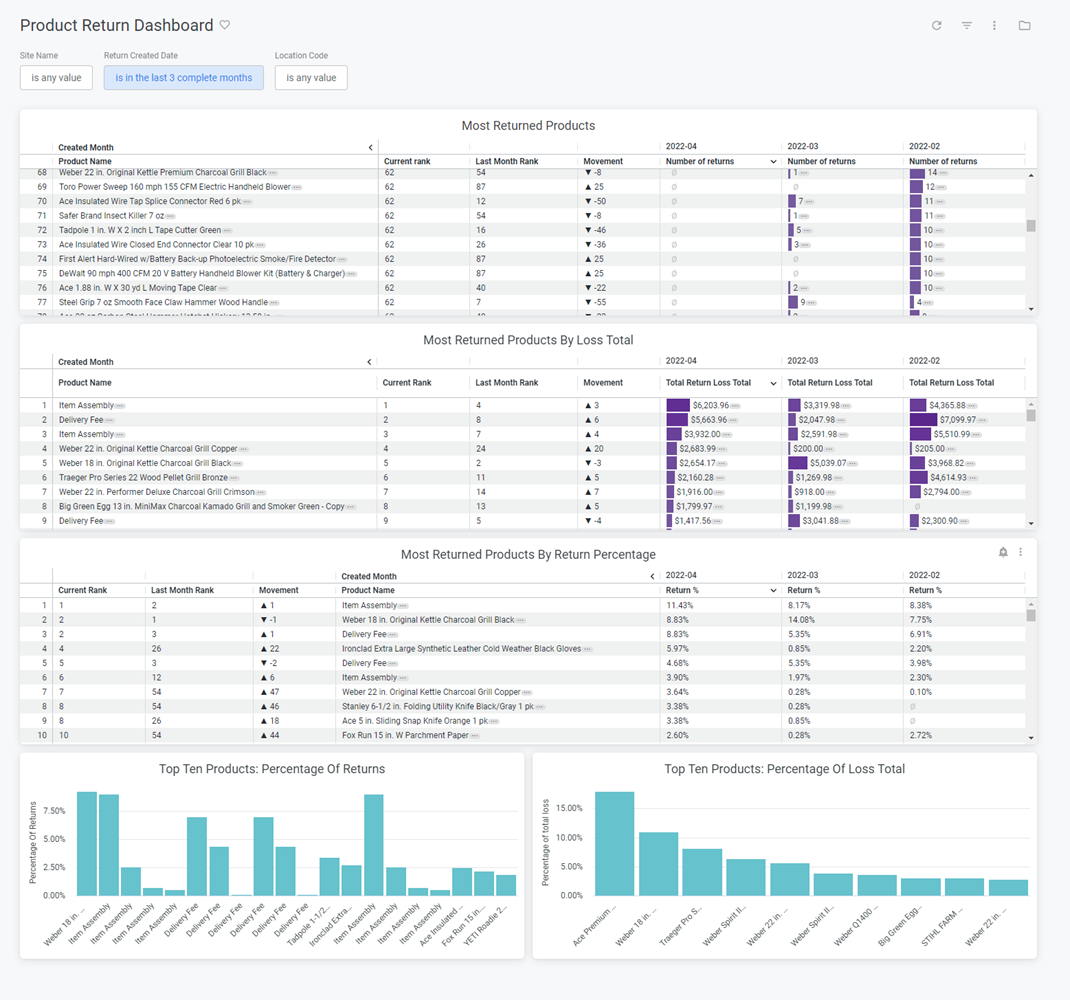
| Most Returned Products | Table listing the products with the highest return count and how that count ranks among all products. |
| Most Returned Products By Loss Total | Table listing the products with the greatest total return loss and how that sum ranks among all products. |
| Most Returned Products By Return Percentage | Table listing the products with the highest return percentage and how that percentage ranks among all products. |
| Top Ten Products: Percentage Of Returns | Column chart listing the ten products that account for the highest percentage of all returns. |
| Top Ten Products: Percentage Of Loss Total | Column chart listing the ten products that account for the highest percentage of the total return loss. |