> ## Documentation Index
> Fetch the complete documentation index at: https://docs.kibocommerce.com/llms.txt
> Use this file to discover all available pages before exploring further.

# Orders Year-to-Date Dashboard

The Orders Year-To-Date dashboard provides an overview of key metrics for the year-to-date with year-over-year comparisons and trends. It can be viewed under the order topic at **Kibo Standard Reports** > **Order** > **Orders Year-To-Date Dashboard** in the navigation menu.

<img src="https://mintcdn.com/kibocommerce-59e68a4a/mirjU24xTFSyw6n2/img/orders-ytd-dashboard.png?fit=max&auto=format&n=mirjU24xTFSyw6n2&q=85&s=e09afdd11555eaef8f7759485b39f8b5" alt="Example of the Orders Year To Date dashboard with total values and line graphs" width="1565" height="2949" data-path="img/orders-ytd-dashboard.png" />

The supported filters that can be applied to this dashboard are:

| Name                   | Description                                                | Default |
| ---------------------- | ---------------------------------------------------------- | ------- |
| Site                   | Restrict results to one or more of your sites.             | All     |
| Billing Country        | The country code from the order billing address.           | All     |
| Billing State/Province | The state or province code from the order billing address. | All     |

The measures that are calculated by this dashboard are:
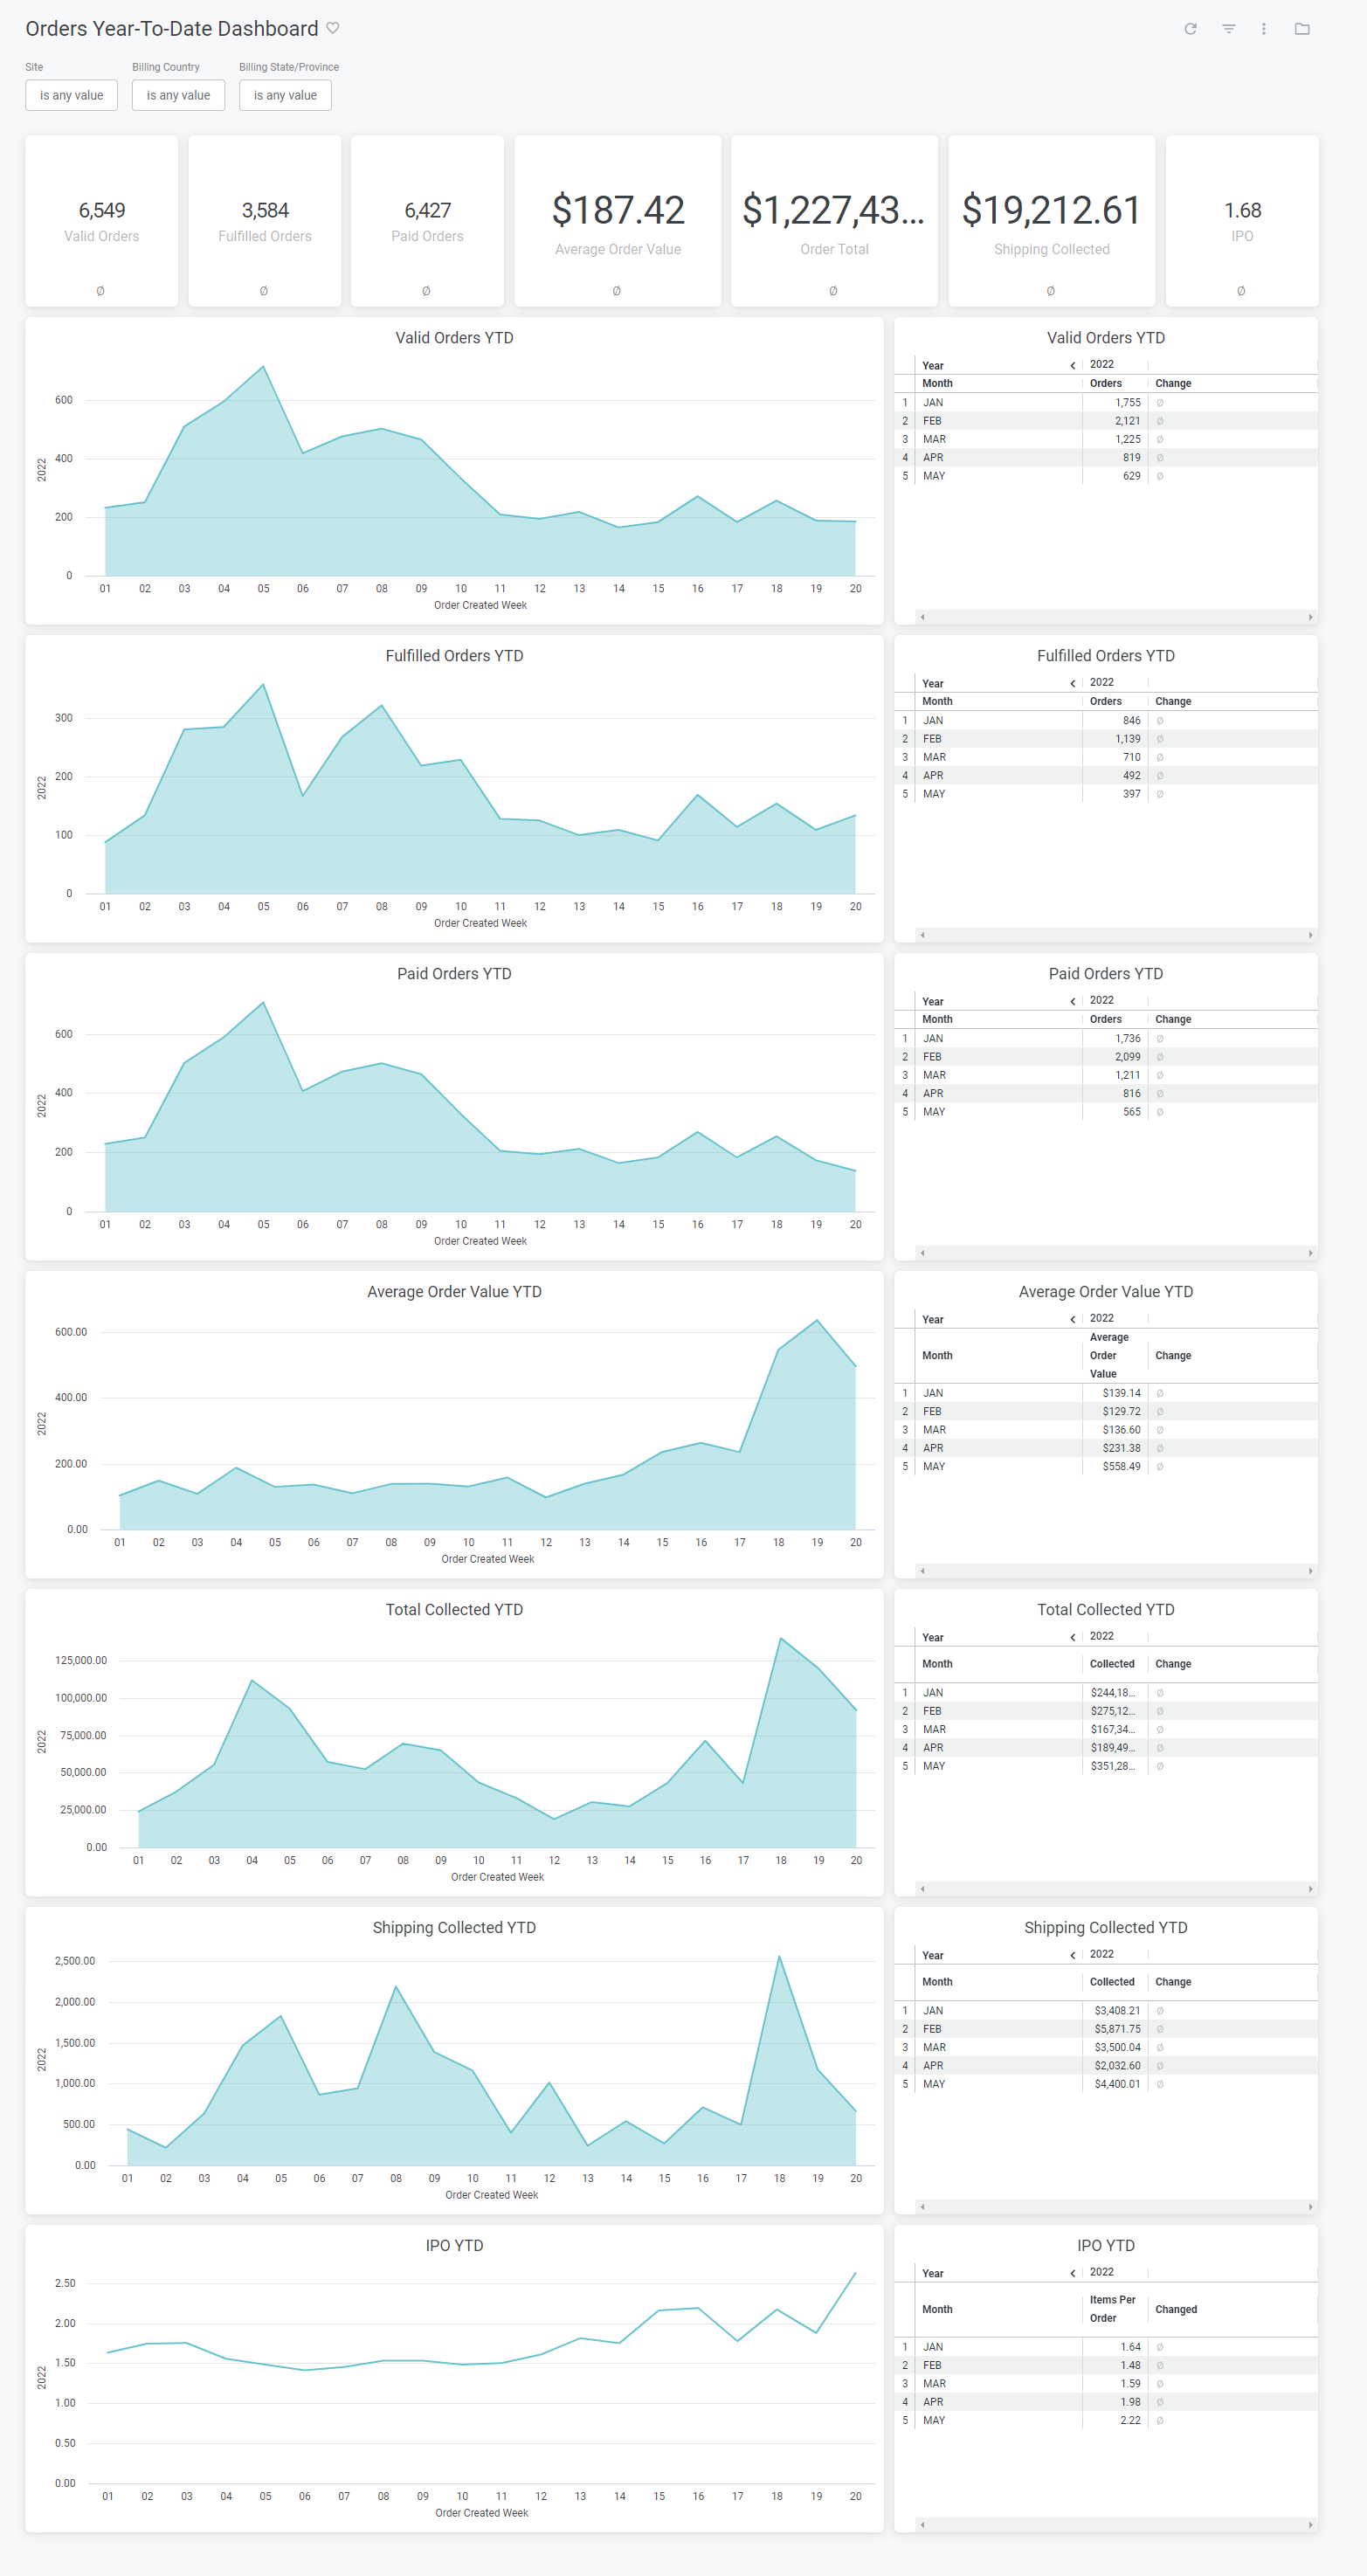
<table><tbody><tr><td><strong>Name</strong></td><td><strong>Description</strong></td></tr><tr><td>Valid Orders Count</td><td>Count of all orders where the order status is not abandoned or canceled.</td></tr><tr><td>Fulfilled Orders Count</td><td>Count of all valid orders where the fulfillment status is fulfilled.</td></tr><tr><td>Paid Orders Count</td><td>Count of all valid orders where the payment status is paid.</td></tr><tr><td>Average Order Value</td><td>The order total divided by the valid order count.</td></tr><tr><td>Order Total</td><td>Sum of the order total for all valid orders.</td></tr><tr><td>Shipping Collected</td><td>Sum of the collected shipping total for all valid orders.</td></tr><tr><td>Items Per Order</td><td>The count of all order items associated with valid orders divided by the count of all valid orders.</td></tr></tbody></table>

The tiles that make up this dashboard are:

| Name                            | Description                                                                                                                                                       |
| ------------------------------- | ----------------------------------------------------------------------------------------------------------------------------------------------------------------- |
| Valid Orders                    | The valid orders count. Year-over-year uses the same calendar dates one year prior to display the change as a percentage rounded to the nearest whole number.     |
| Fulfilled Orders                | The fulfilled orders count. Year-over-year uses the same calendar dates one year prior to display the change as a percentage rounded to the nearest whole number. |
| Paid Orders                     | The paid orders count. Year-over-year uses the same calendar dates one year prior to display the change as a percentage rounded to the nearest whole number.      |
| Average Order Value             | The average order vallue. Year-over-year uses the same calendar dates one year prior to display the change as a percentage rounded to the nearest whole number.   |
| Order Total                     | The order total. Year-over-year uses the same calendar dates one year prior to display the change as a percentage rounded to the nearest whole number.            |
| Shipping Collected              | The sum of the collecting shipping total for all valid orders.                                                                                                    |
| Items Per Order                 | The items per order. Year-over-year uses the same calendar dates one year prior to display the change as a percentage rounded to the nearest whole number.        |
| Valid Orders YTD (Area)         | The valid orders count bucketed by week of the year. Year-over-year uses the same week number from the previous year.                                             |
| Valid Orders YTD (Table)        | The valid orders count bucketed by calendar month. Year-over-year uses the same calendar month from the previous year.                                            |
| Fulfilled Orders YTD (Area)     | The fulfilled orders count bucketed by week of the year. Year-over-year uses the same week number from the previous year.                                         |
| Fulfilled Orders YTD (Table)    | The fulfilled orders count bucketed by calendar month. Year-over-year uses the same calendar month from the previous year.                                        |
| Paid Orders YTD (Area)          | The paid orders count bucketed by week of the year. Year-over-year uses the same week number from the previous year.                                              |
| Paid Orders YTD (Table)         | The paid orders count bucketed by calendar month. Year-over-year uses the same calendar month from the previous year.                                             |
| Average Order Value YTD (Area)  | The average order value count bucketed by week of the year. Year-over-year uses the same week number from the previous year.                                      |
| Average Order Value YTD (Table) | The average order value bucketed by calendar month. Year-over-year uses the same calendar month from the previous year.                                           |
| Order Total YTD (Area)          | The order total count bucketed by week of the year. Year-over-year uses the same week number from the previous year.                                              |
| Order Total YTD (Table)         | The order total count bucketed by calendar month. Year-over-year uses the same calendar month from the previous year.                                             |
| Shipping Collected YTD (Area)   | The shipping total bucketed by week of the year. Year-over-year uses the same week number from the previous year.                                                 |
| Shipping Collected YTD (Table)  | The shipping total bucketed by calendar month. Year-over-year uses the same calendar month from the previous year.                                                |
| Items Per Order YTD (Area)      | The items per order bucketed by week of the year. Year-over-year uses the same week number from the previous year.                                                |
| Items Per Order YTD (Table)     | The items per order bucketed by calendar month. Year-over-year uses the same calendar month from the previous year.                                               |
