> ## Documentation Index
> Fetch the complete documentation index at: https://docs.kibocommerce.com/llms.txt
> Use this file to discover all available pages before exploring further.
# Fulfillment SLA Dashboard
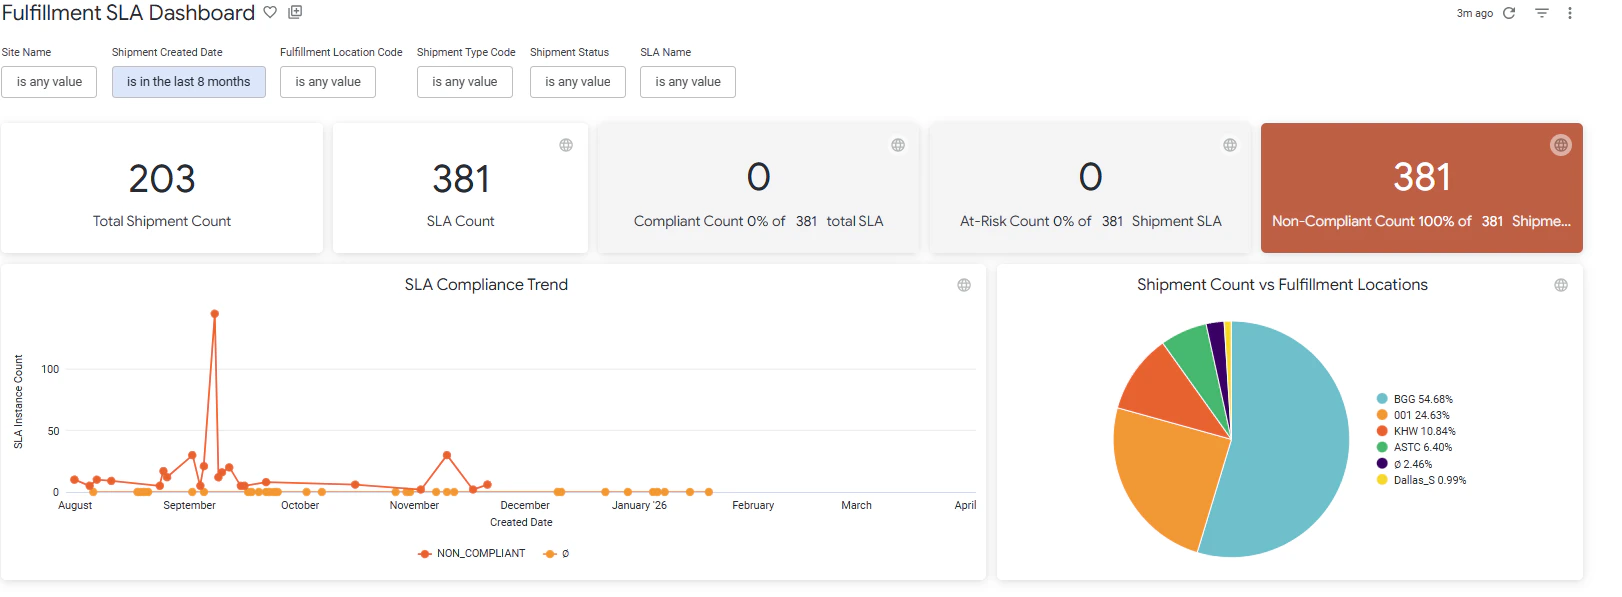
The Fulfillment SLA Dashboard provides historical analysis of SLA performance across locations, fulfillment types, and time periods. This helps in analyzing trend identification, comparative analysis, and performance benchmarking. This can be viewed under the shipment topic at **Kibo Standard Reports** > **Shipment** > **Fulfillment SLA Dashboard** in the navigation menu.
 ***
The supported filters that can be applied to this dashboard are:
| Name | Description | Default |
| :-------------------- | :------------------------------------------------------------------------------------------------ | :----------- |
| Site Name | Restrict results to one or more of your sites. | All |
| Shipment Created Date | Limit results to only shipments created within this time range. | Last 30 days |
| Location Code | The location codes where the shipments were fulfilled. | All |
| Shipment Type | The fulfillment method used, such as Ship to Home, BOPIS, Curbside Pickup, Delivery, or Transfer. | All |
| SLA | The specific SLA(s) to analyze, sorted alphabetically by name. | All |
| Shipment Status | The status of the shipment such as canceled, Rejected, or fulfilled. | All |
The measures that are calculated by this dashboard are:
| Name | Description |
| :----------------------- | :--------------------------------------------------------------------------------------------------------------------------------------------------------------------- |
| Total Shipments with SLA | Count of all distinct shipment records that have an SLA assignment within the selected time frame. |
| SLA Count | Count of all SLA instances associated with shipments in the selected time frame. |
| Compliant Count | Count of SLA instances where the compliance level is Compliant (below 80% of allowed time), displayed as a count and percentage of total SLA instances. |
| At Risk Count | Count of SLA instances where the compliance level is At Risk (80–99% of allowed time), displayed as a count and percentage of total SLA instances. |
| Non-Compliant Count | Count of SLA instances where the compliance level is Non-Compliant (at or exceeding 100% of allowed time), displayed as a count and percentage of total SLA instances. |
The tiles that make up this dashboard are:
| Name | Description |
| :-------------------------------------- | :------------------------------------------------------------------------------------------------------------------------------------------- |
| Total Shipments with SLA | Total number of shipment records that have an SLA assignment within the selected time frame. |
| SLA Count | The total number of SLA instances across all shipments in the selected time frame. |
| Compliant Count | The number and percentage of SLA instances that are Compliant. Clicking this tile opens the [SLA Breakdown modal](#sla-breakdown-modal). |
| At Risk Count | The number and percentage of SLA instances that are At Risk. Clicking this tile opens the [SLA Breakdown modal](#sla-breakdown-modal). |
| Non-Compliant Count | The number and percentage of SLA instances that are Non-Compliant. Clicking this tile opens the [SLA Breakdown modal](#sla-breakdown-modal). |
| SLA Compliance Trend | A time-series line chart showing SLA instance counts over the selected date range, plotted by shipment created date. |
| Shipment Count vs Fulfillment Locations | A pie chart showing the distribution of shipments across fulfillment locations as a percentage of total shipment count. |
## SLA Breakdown Modal
Clicking the Compliant Count, At-Risk Count, or Non-Compliant Count tile opens a detailed breakdown modal filtered to that compliance level.
***
The supported filters that can be applied to this dashboard are:
| Name | Description | Default |
| :-------------------- | :------------------------------------------------------------------------------------------------ | :----------- |
| Site Name | Restrict results to one or more of your sites. | All |
| Shipment Created Date | Limit results to only shipments created within this time range. | Last 30 days |
| Location Code | The location codes where the shipments were fulfilled. | All |
| Shipment Type | The fulfillment method used, such as Ship to Home, BOPIS, Curbside Pickup, Delivery, or Transfer. | All |
| SLA | The specific SLA(s) to analyze, sorted alphabetically by name. | All |
| Shipment Status | The status of the shipment such as canceled, Rejected, or fulfilled. | All |
The measures that are calculated by this dashboard are:
| Name | Description |
| :----------------------- | :--------------------------------------------------------------------------------------------------------------------------------------------------------------------- |
| Total Shipments with SLA | Count of all distinct shipment records that have an SLA assignment within the selected time frame. |
| SLA Count | Count of all SLA instances associated with shipments in the selected time frame. |
| Compliant Count | Count of SLA instances where the compliance level is Compliant (below 80% of allowed time), displayed as a count and percentage of total SLA instances. |
| At Risk Count | Count of SLA instances where the compliance level is At Risk (80–99% of allowed time), displayed as a count and percentage of total SLA instances. |
| Non-Compliant Count | Count of SLA instances where the compliance level is Non-Compliant (at or exceeding 100% of allowed time), displayed as a count and percentage of total SLA instances. |
The tiles that make up this dashboard are:
| Name | Description |
| :-------------------------------------- | :------------------------------------------------------------------------------------------------------------------------------------------- |
| Total Shipments with SLA | Total number of shipment records that have an SLA assignment within the selected time frame. |
| SLA Count | The total number of SLA instances across all shipments in the selected time frame. |
| Compliant Count | The number and percentage of SLA instances that are Compliant. Clicking this tile opens the [SLA Breakdown modal](#sla-breakdown-modal). |
| At Risk Count | The number and percentage of SLA instances that are At Risk. Clicking this tile opens the [SLA Breakdown modal](#sla-breakdown-modal). |
| Non-Compliant Count | The number and percentage of SLA instances that are Non-Compliant. Clicking this tile opens the [SLA Breakdown modal](#sla-breakdown-modal). |
| SLA Compliance Trend | A time-series line chart showing SLA instance counts over the selected date range, plotted by shipment created date. |
| Shipment Count vs Fulfillment Locations | A pie chart showing the distribution of shipments across fulfillment locations as a percentage of total shipment count. |
## SLA Breakdown Modal
Clicking the Compliant Count, At-Risk Count, or Non-Compliant Count tile opens a detailed breakdown modal filtered to that compliance level.
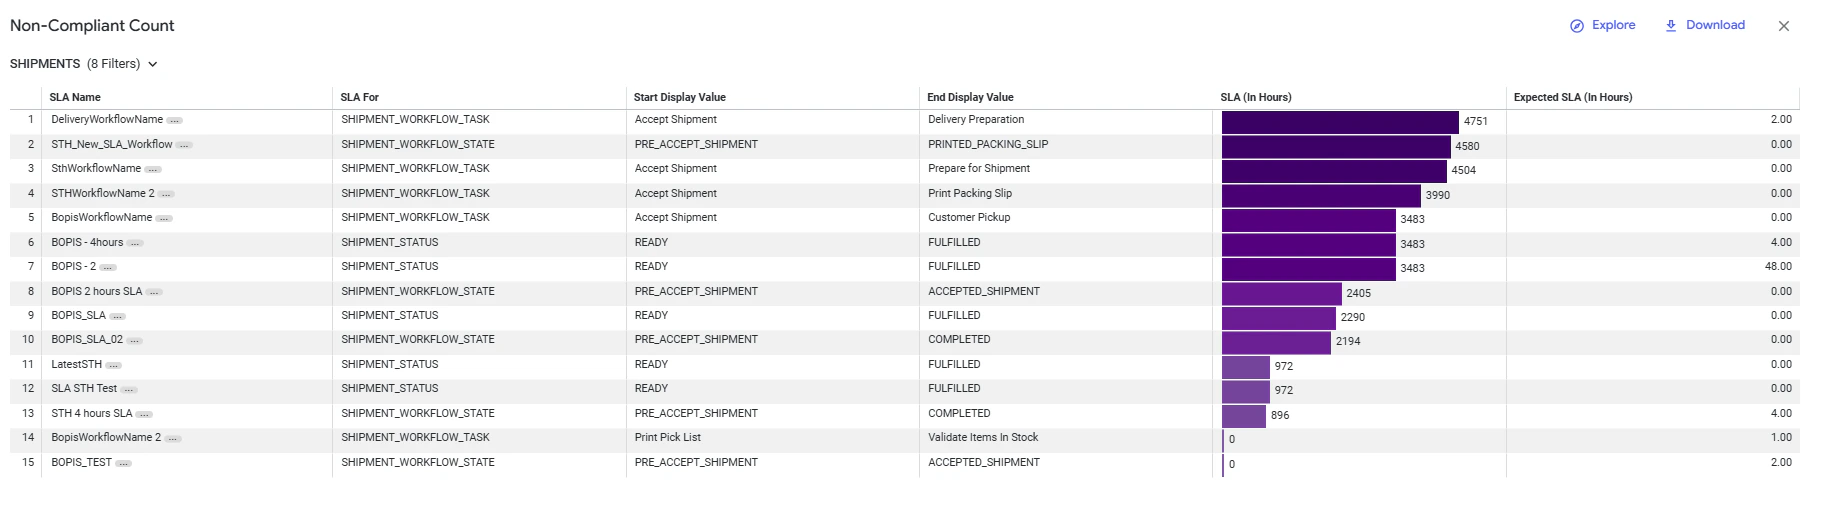 The columns displayed in the SLA Breakdown modal are:
| Name | Description |
| :---------------------- | :------------------------------------------------------------------------------------------------------------------------------------------- |
| SLA Name | The name of the configured SLA. |
| SLA For | The entity the SLA is measured against, such as `SHIPMENT_STATUS`, `SHIPMENT_WORKFLOW_STATE`, or `SHIPMENT_WORKFLOW_TASK`. |
| Start Display Value | The starting point of the SLA measurement window, such as `READY` or `Accept Shipment`. |
| End Display Value | The ending point of the SLA measurement window, such as `FULFILLED` or `Delivery Preparation`. |
| SLA (In Hours) | The actual average time, in hours, that shipments are taking for this SLA. Displayed as a bar visualization for easy comparison across SLAs. |
| Expected SLA (In Hours) | The configured time limit for this SLA, in hours. |
Clicking an SLA Name in the breakdown modal opens the **Individual SLA Steps Dashboard** for that SLA.
***
## Individual SLA Steps Dashboard
The Individual SLA Steps Dashboard provides a step-level view of average workflow task durations for a specific SLA. This view helps in analyzing time spent at each step of the fulfillment workflow, supporting performance monitoring, trend identification, and operational optimization. It can be accessed by clicking an SLA name in the SLA Breakdown modal.
The columns displayed in the SLA Breakdown modal are:
| Name | Description |
| :---------------------- | :------------------------------------------------------------------------------------------------------------------------------------------- |
| SLA Name | The name of the configured SLA. |
| SLA For | The entity the SLA is measured against, such as `SHIPMENT_STATUS`, `SHIPMENT_WORKFLOW_STATE`, or `SHIPMENT_WORKFLOW_TASK`. |
| Start Display Value | The starting point of the SLA measurement window, such as `READY` or `Accept Shipment`. |
| End Display Value | The ending point of the SLA measurement window, such as `FULFILLED` or `Delivery Preparation`. |
| SLA (In Hours) | The actual average time, in hours, that shipments are taking for this SLA. Displayed as a bar visualization for easy comparison across SLAs. |
| Expected SLA (In Hours) | The configured time limit for this SLA, in hours. |
Clicking an SLA Name in the breakdown modal opens the **Individual SLA Steps Dashboard** for that SLA.
***
## Individual SLA Steps Dashboard
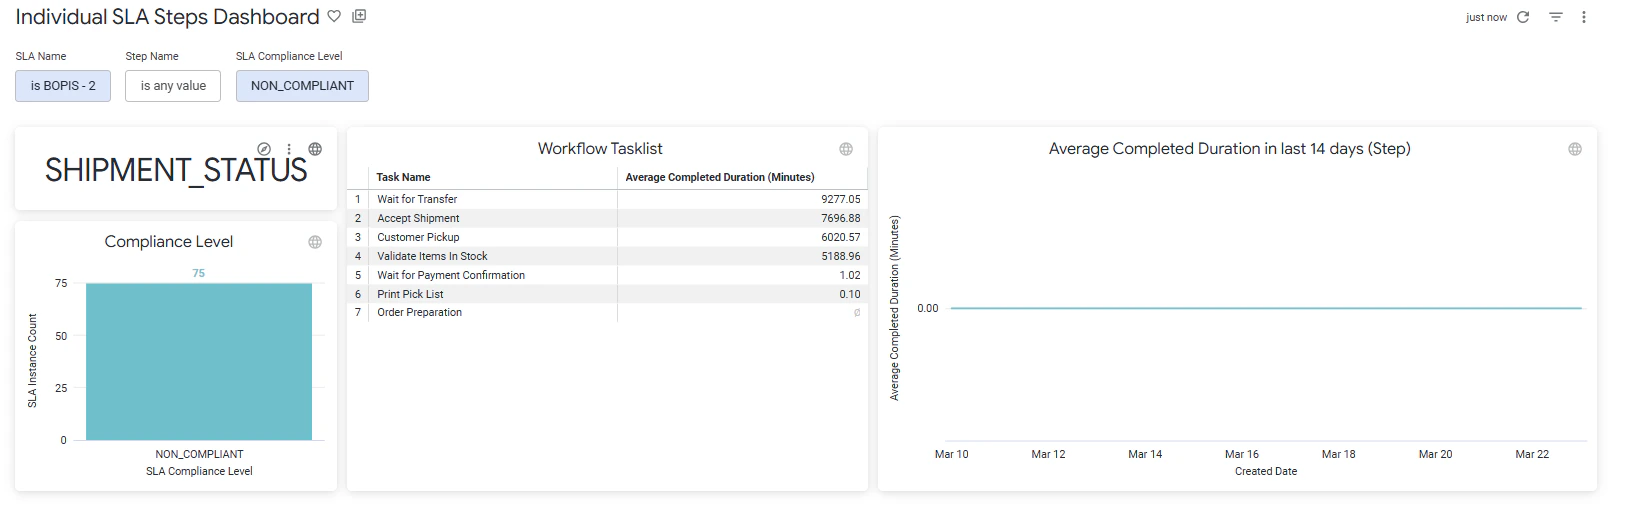
The Individual SLA Steps Dashboard provides a step-level view of average workflow task durations for a specific SLA. This view helps in analyzing time spent at each step of the fulfillment workflow, supporting performance monitoring, trend identification, and operational optimization. It can be accessed by clicking an SLA name in the SLA Breakdown modal.
 The supported filters that can be applied to this dashboard are:
| Name | Description | Default |
| :------------------- | :------------------------------------------------------------------------------------------------------------ | :------------------------------------- |
| SLA Name | The SLA to analyze. Pre-populated from the selected SLA in the breakdown modal. | Selected SLA |
| Step Name | Filter results to a specific workflow task step. All steps defined for the selected SLA are shown by default. | Any value |
| SLA Compliance Level | Filter to a specific compliance level: Compliant, At Risk, or Non-Compliant. | Pre-Populated from SLA breakdown Modal |
The tiles that make up this dashboard are:
| Name | Description |
| :------------------------------------------------ | :---------------------------------------------------------------------------------------------------------------------------------------------------------------------------------------------------------------------- |
| SLA For | Displays the SLA measurement type for the selected SLA (e.g., `SHIPMENT_STATUS` or `SHIPMENT_WORKFLOW_TASK`). |
| Compliance Level | A bar chart showing the count of SLA instances by compliance level (Compliant, At Risk, Non-Compliant) for the selected SLA and filters. |
| Workflow Task list | A table listing each workflow task step with its average completed duration in minutes, calculated from step start and completion timestamps. |
| Average Completed Duration in last 14 days (Step) | A time-series line chart showing the average completed duration per workflow step over the last 14 days, plotted by shipment created date. This enables identification of step-level performance degradation over time. |
The supported filters that can be applied to this dashboard are:
| Name | Description | Default |
| :------------------- | :------------------------------------------------------------------------------------------------------------ | :------------------------------------- |
| SLA Name | The SLA to analyze. Pre-populated from the selected SLA in the breakdown modal. | Selected SLA |
| Step Name | Filter results to a specific workflow task step. All steps defined for the selected SLA are shown by default. | Any value |
| SLA Compliance Level | Filter to a specific compliance level: Compliant, At Risk, or Non-Compliant. | Pre-Populated from SLA breakdown Modal |
The tiles that make up this dashboard are:
| Name | Description |
| :------------------------------------------------ | :---------------------------------------------------------------------------------------------------------------------------------------------------------------------------------------------------------------------- |
| SLA For | Displays the SLA measurement type for the selected SLA (e.g., `SHIPMENT_STATUS` or `SHIPMENT_WORKFLOW_TASK`). |
| Compliance Level | A bar chart showing the count of SLA instances by compliance level (Compliant, At Risk, Non-Compliant) for the selected SLA and filters. |
| Workflow Task list | A table listing each workflow task step with its average completed duration in minutes, calculated from step start and completion timestamps. |
| Average Completed Duration in last 14 days (Step) | A time-series line chart showing the average completed duration per workflow step over the last 14 days, plotted by shipment created date. This enables identification of step-level performance degradation over time. |