> ## Documentation Index
> Fetch the complete documentation index at: https://docs.kibocommerce.com/llms.txt
> Use this file to discover all available pages before exploring further.
# Custom Reports
Custom reports can be either created from an existing report or created from scratch, and viewed by everyone with the appropriate reporting permissions. You have the option to directly download reports, send them to an email address, or send them to an SFTP droppoint.
Learn how to explore and customize reports
## SFTP Best Practices
If you are using a client-side or third-party SFTP droppoint to receive reports, Kibo recommends following the below guidelines to maximize performance.
* Ensuring access to the SFTP droppoint is the responsibility of the client or third party maintainer. Make sure that Kibo's SFTP user has read and write permissions to the directory, which is required to deliver files.
* For example, in the command line this may look like `drw-rw-r--` (which means the owner has read/write, the group has read/write, others are read-only)
* Ensure files do not pile up over time. Utilize /archive folders and periodic cleanup of historic data. Monitor the droppoint and clean up files that are no longer needed.
* If you need to retain the files, archive them to another folder once they’ve been processed.
* Ensure disk space usage is monitored and alerts the maintaining IT team in time to address low disk space situations before causing connection issues for Kibo.
## Create From Existing Report
A Report Editor user can create custom reports by editing an existing report.
1. Click on right top corner of a tile and then **Explore from Here**. 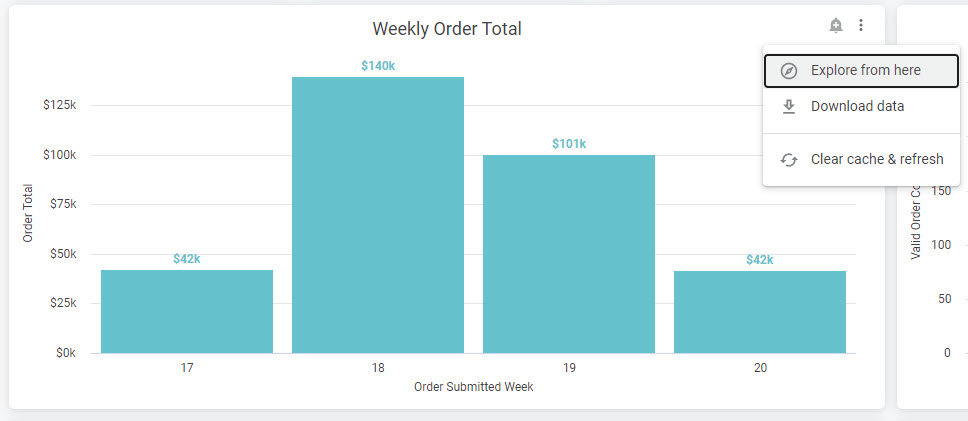 2. The Explore page displays all current report dimensions and measures. It is possible that this will change the page header to an older version of the UI, but you can still navigate the folder directory and access other options in the top right corner.
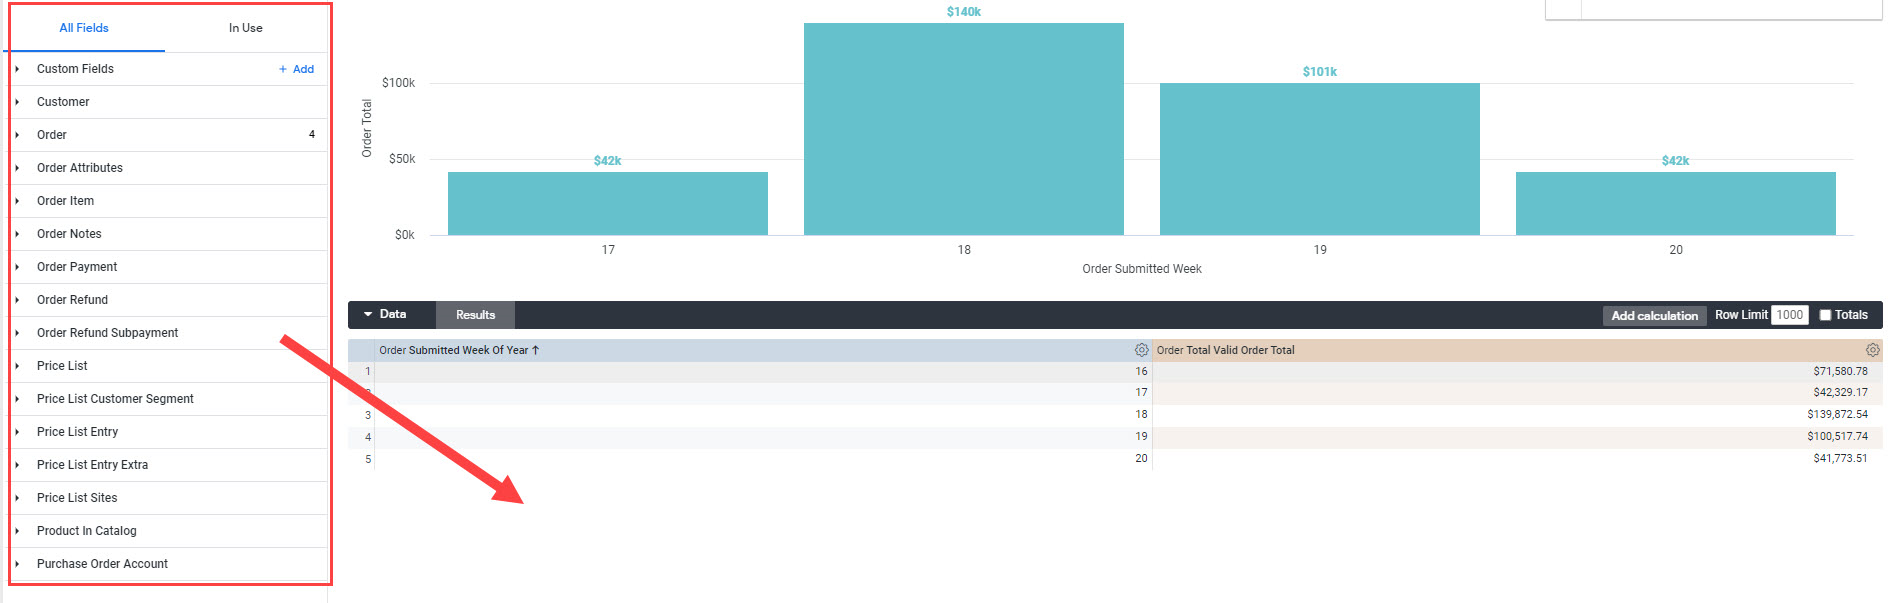
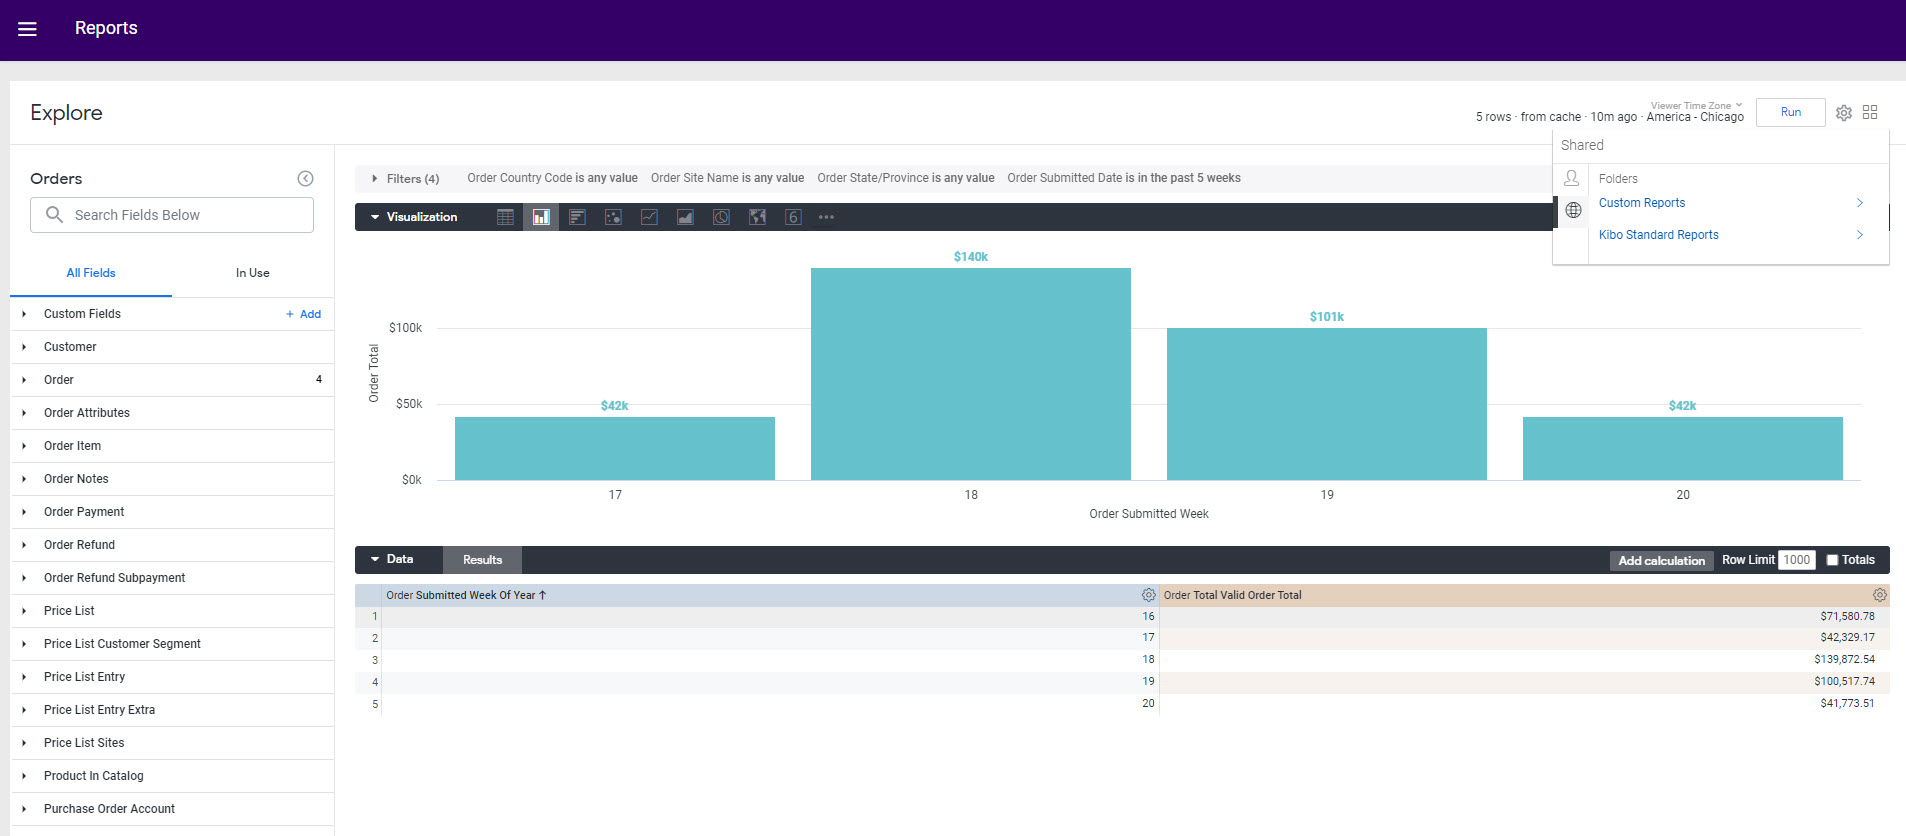 3. Change fields by pulling dimensions and measures from the left pane into the **Data** section in the right pane.
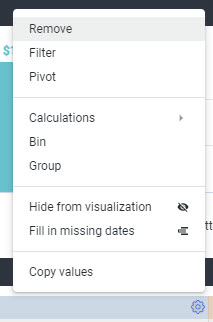
 4. You can further configure the Data section by clicking the gear icon on a table and changing settings such as calculations, hiding that data from the visualization, filling in missing dates, etc.
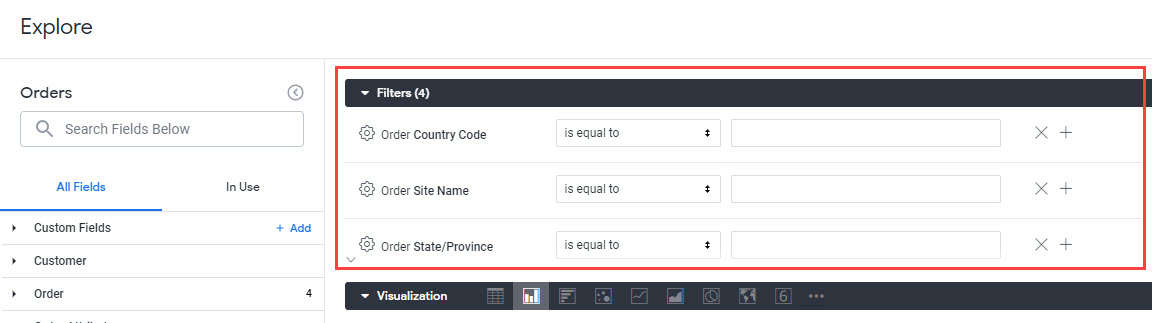
 5. Expand the **Filters** section to configure the applied filters.
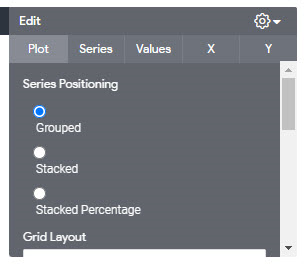
 6. You can further edit the Visualization section by clicking **Edit** on the right and changing the axis, positioning, layout, etc.
 7. Click **Run** in the top right to generate the report.
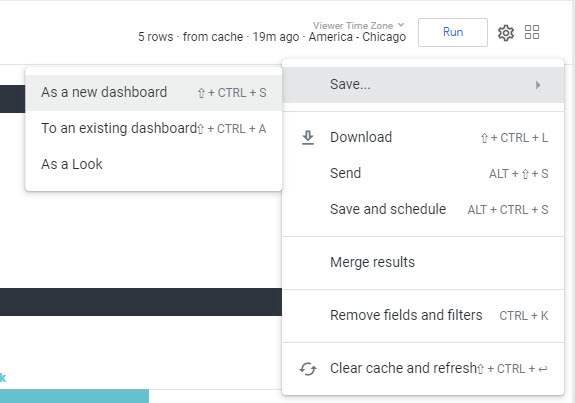
 8. To save the report, click on the gear icon and select whether to save it as a look (saving the individual report to view in the future) or to a dashboard (adding the report as a tile on a larger dashboard with other reports).
 9. If you click **Save as Look**, a modal will appear with several options. Enter a title and description for this custom report.
10. Select whether to save the report to your Personal (where only the creator of the report can access it) or Shared (where all Report Viewers across the organization can access the report and Report Editors can also modify the report) folder.
9. If you click **Save as Look**, a modal will appear with several options. Enter a title and description for this custom report.
10. Select whether to save the report to your Personal (where only the creator of the report can access it) or Shared (where all Report Viewers across the organization can access the report and Report Editors can also modify the report) folder.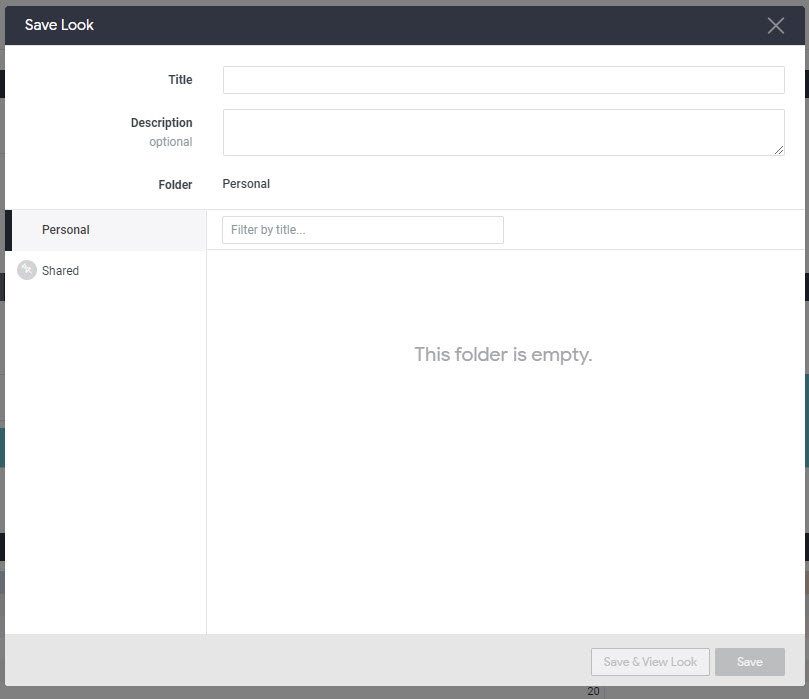 ## Create From Scratch
Rather than base the new report off of an existing one, the Reporting Editor can also create and save their own reports from the data found in the explores.
1. In the folder navigation, go to **Shared** > **Kibo Standard Reports** > **Explores**.
2. Select the explore to base the report on.
## Create From Scratch
Rather than base the new report off of an existing one, the Reporting Editor can also create and save their own reports from the data found in the explores.
1. In the folder navigation, go to **Shared** > **Kibo Standard Reports** > **Explores**.
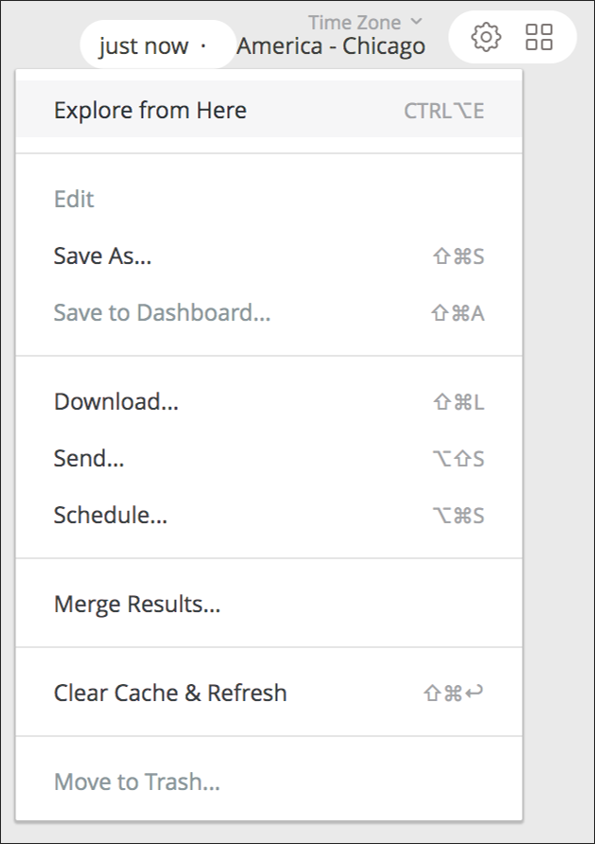
2. Select the explore to base the report on.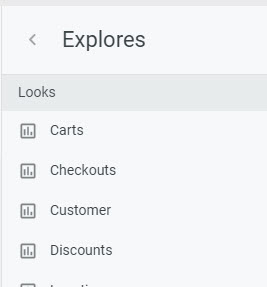 3. From that screen, expand the gear icon at the top right and click **Explore From Here**.
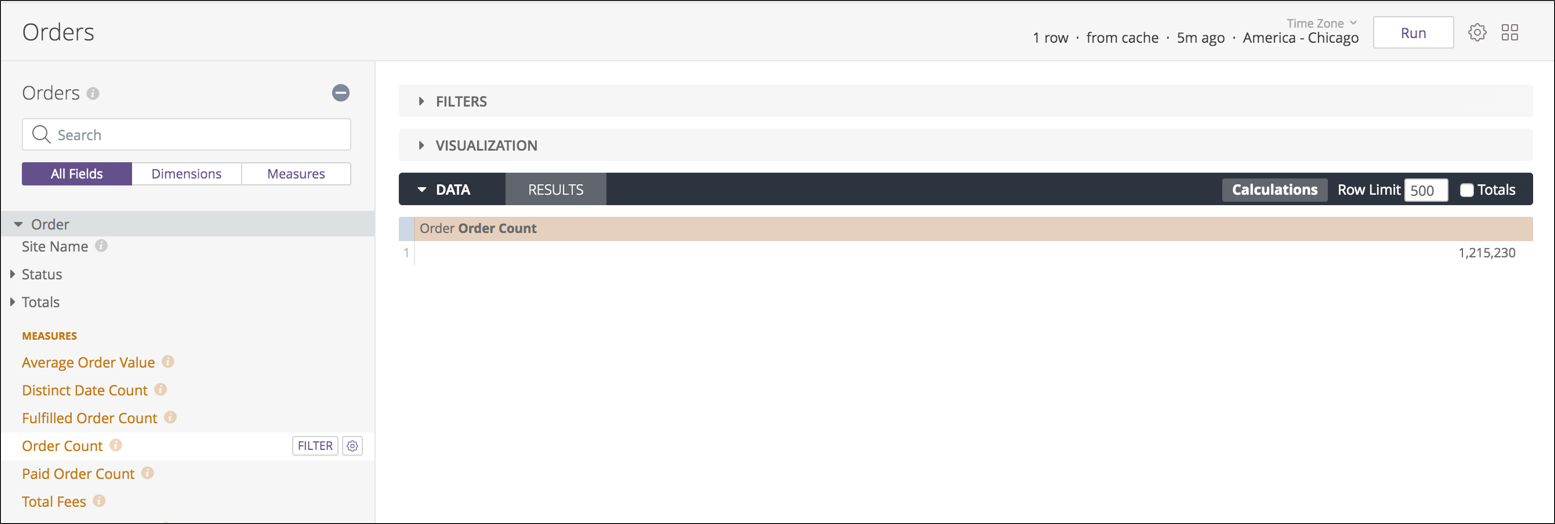
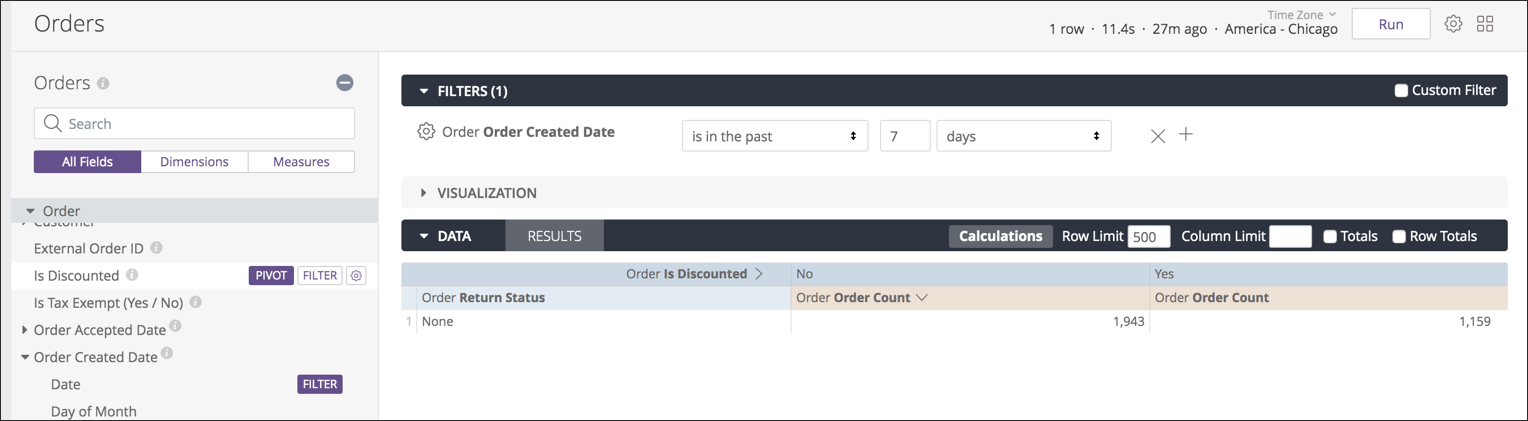
 4. Customization options will be displayed. Select the dimensions and measures to include in the report from the menu on the left. Each selected dimension or measure will show up in the **Data** tab in the right.
 5. The **Data** section displays the raw report results and includes features such as selecting sort order for columns, specifying the maximum rows to return, dragging and dropping columns to reorder them, and adding custom calculations. View pivots by hovering over a dimension and clicking **Pivot**.
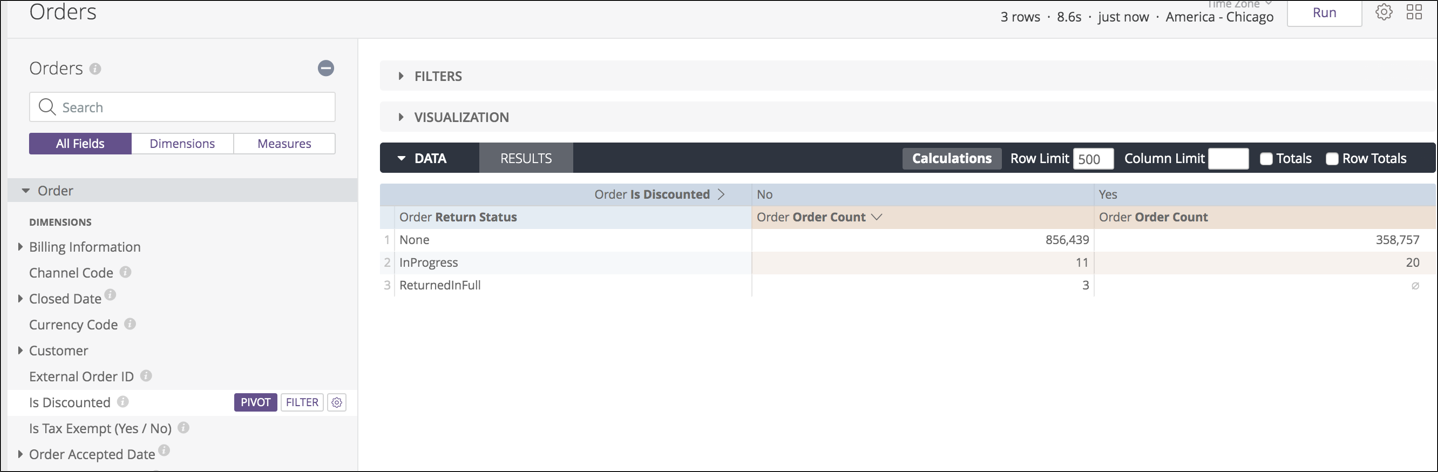 6. Filters can be added the same way. Expand the **Filters** section and configure the values for filters there.
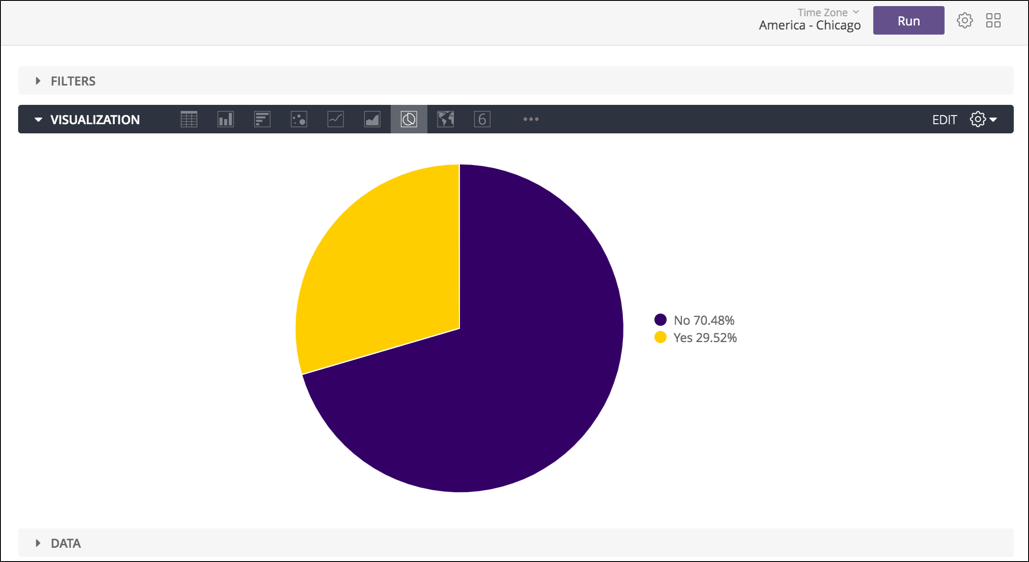
 7. Once all data has been selected and filters have been applied, expand the **Visualization** tab to see a graphical depiction of what the report would look like as a tile. Select different visualization types to analyze which works best for the data. For more control, use the gear icon in the top right to access more granular configurations.
 8. Click the top-level gear icon to save the new report. It can be saved as an individual look or added to a dashboard, as well as directly downloaded or sent via email/SFTP/etc. A **Save & Schedule** option will save the report as a look and set up recurring delivery.
## View Custom Reports
The shared folder, where all Report Viewers in the organization can access the report and all Report Editors can modify the report, is located at **Shared** > **Custom Reports**.
8. Click the top-level gear icon to save the new report. It can be saved as an individual look or added to a dashboard, as well as directly downloaded or sent via email/SFTP/etc. A **Save & Schedule** option will save the report as a look and set up recurring delivery.
## View Custom Reports
The shared folder, where all Report Viewers in the organization can access the report and all Report Editors can modify the report, is located at **Shared** > **Custom Reports**.